SOM cluster: 344
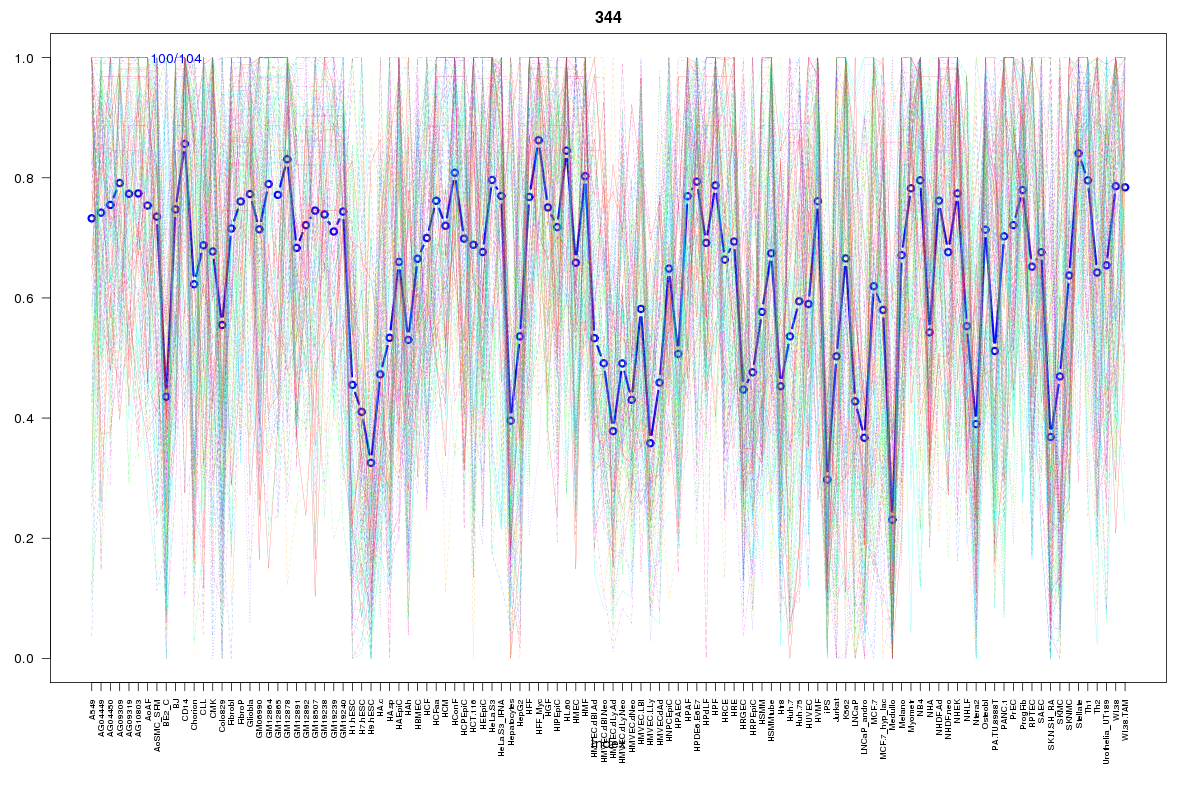
Cluster Hypersensitivity Profile

Genomic Location Trend
These plots show the distribution of the DHS sites surrounding the Transcript Start Site of the nearest gene.
Stats
Number of sites: 104Promoter: 37%
CpG-Island: 26%
Conserved: 57%
Enriched Motifs & Matches
Match Detail: [Jaspar]
|
| ||
|---|---|---|
| Sites: 23/100 | e-val: 0.00013 | ||
| Factor | e-val(match) | DB |
| SP1 | 0.00000053985 | JASPAR |
| Egr1 | 0.00077166 | JASPAR |
| TP53 | 0.0011953 | JASPAR |
| RREB1 | 0.0027061 | JASPAR |
| Klf4 | 0.0042946 | JASPAR |
|
| ||
| Sites: 24/100 | e-val: 2.1 | ||
| Factor | e-val(match) | DB |
| AP1 | 0.000000000023278 | JASPAR |
| NFE2L2 | 0.0000000096695 | JASPAR |
| Foxa2 | 0.0036415 | JASPAR |
| PPARG | 0.0040414 | JASPAR |
| NFE2L1::MafG | 0.0060321 | JASPAR |
BED file downloads
Top 10 Example Regions
| Location | Gene Link | Dist. |
|---|---|---|
| chr9: 116364460-116364610 | RP11-168K11.2 | 48.24 |
| chr17: 43306480-43306630 | CTD-2020K17.4 | 52.4 |
| chr17: 43306480-43306630 | FMNL1 | 52.4 |
| chr17: 43306480-43306630 | HEXIM1 | 52.4 |
| chr6: 122720400-122720550 | SERINC1 | 56.64 |
| chr17: 78193360-78193510 | SLC26A11 | 68.73 |
| chr17: 78193360-78193510 | GAA | 68.73 |
| chr16: 48400500-48400650 | LONP2 | 74.23 |
| chr3: 5068220-5068370 | BHLHE40 | 78.54 |
| chr3: 5068220-5068370 | BHLHE40-AS1 | 78.54 |