SOM cluster: 347
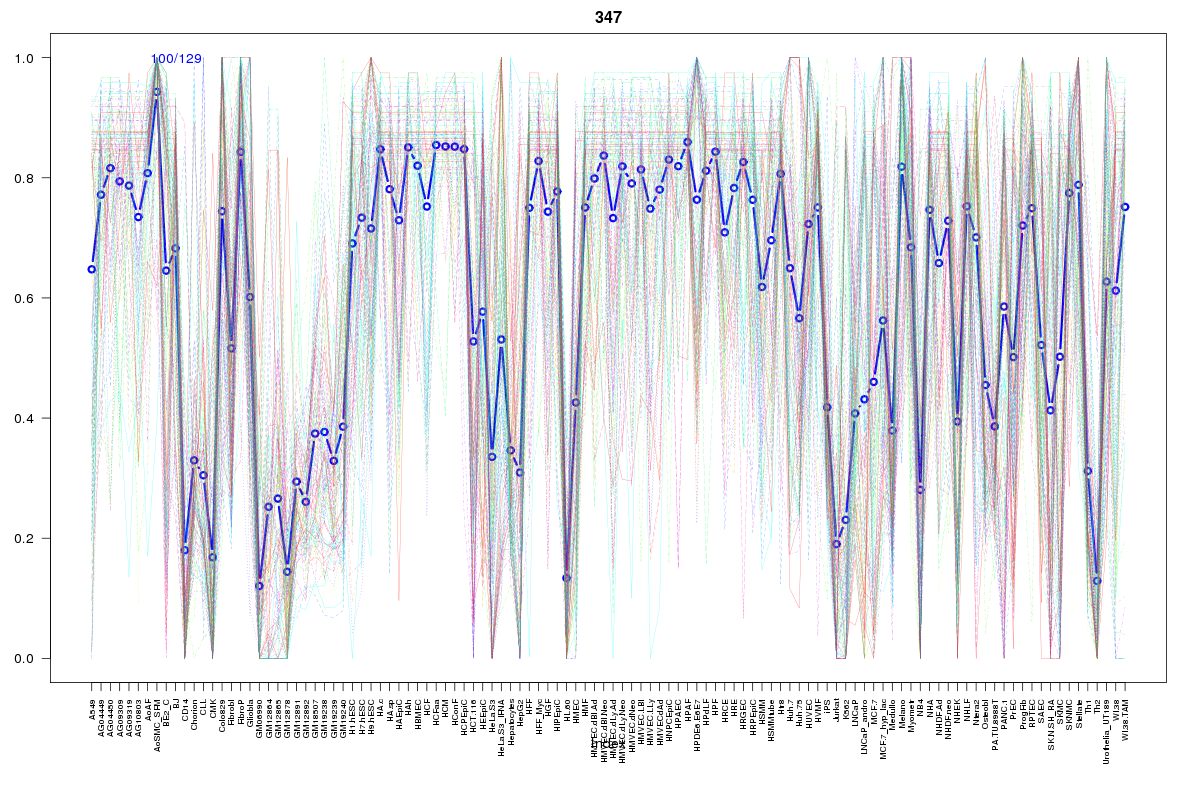
Cluster Hypersensitivity Profile

Genomic Location Trend
These plots show the distribution of the DHS sites surrounding the Transcript Start Site of the nearest gene.
Stats
Number of sites: 129Promoter: 17%
CpG-Island: 3%
Conserved: 86%
Enriched Motifs & Matches
Match Detail: [Jaspar]
|
| ||
|---|---|---|
| Sites: 26/100 | e-val: 0.0000053 | ||
| Factor | e-val(match) | DB |
| Pax4 | 0.0000000010217 | JASPAR |
| RREB1 | 0.000000063678 | JASPAR |
| SP1 | 0.00000012067 | JASPAR |
| EWSR1-FLI1 | 0.000053821 | JASPAR |
| Tal1::Gata1 | 0.00014975 | JASPAR |
|
| ||
| Sites: 30/100 | e-val: 0.000038 | ||
| Factor | e-val(match) | DB |
| CTCF | 0.000000000085441 | JASPAR |
| INSM1 | 0.0035702 | JASPAR |
| TAL1::TCF3 | 0.023152 | JASPAR |
| ZNF354C | 0.032295 | JASPAR |
| PPARG::RXRA | 0.033462 | JASPAR |
BED file downloads
Top 10 Example Regions
| Location | Gene Link | Dist. |
|---|---|---|
| chr1: 147013000-147013150 | BCL9 | 13.02 |
| chr1: 183287680-183287830 | RP11-548N1.1 | 42.28 |
| chr1: 162666260-162666410 | RN7SL861P | 53.47 |
| chr1: 162666260-162666410 | HSD17B7 | 53.47 |
| chr1: 162666260-162666410 | DDR2 | 53.47 |
| chr9: 97545400-97545550 | C9orf3 | 55.63 |
| chr5: 121465140-121465290 | LOX | 67.16 |
| chrX: 106045780-106045930 | TBC1D8B | 68.81 |
| chr3: 171489140-171489290 | PLD1 | 70.59 |
| chr3: 171489140-171489290 | PP13439 | 70.59 |