SOM cluster: 365
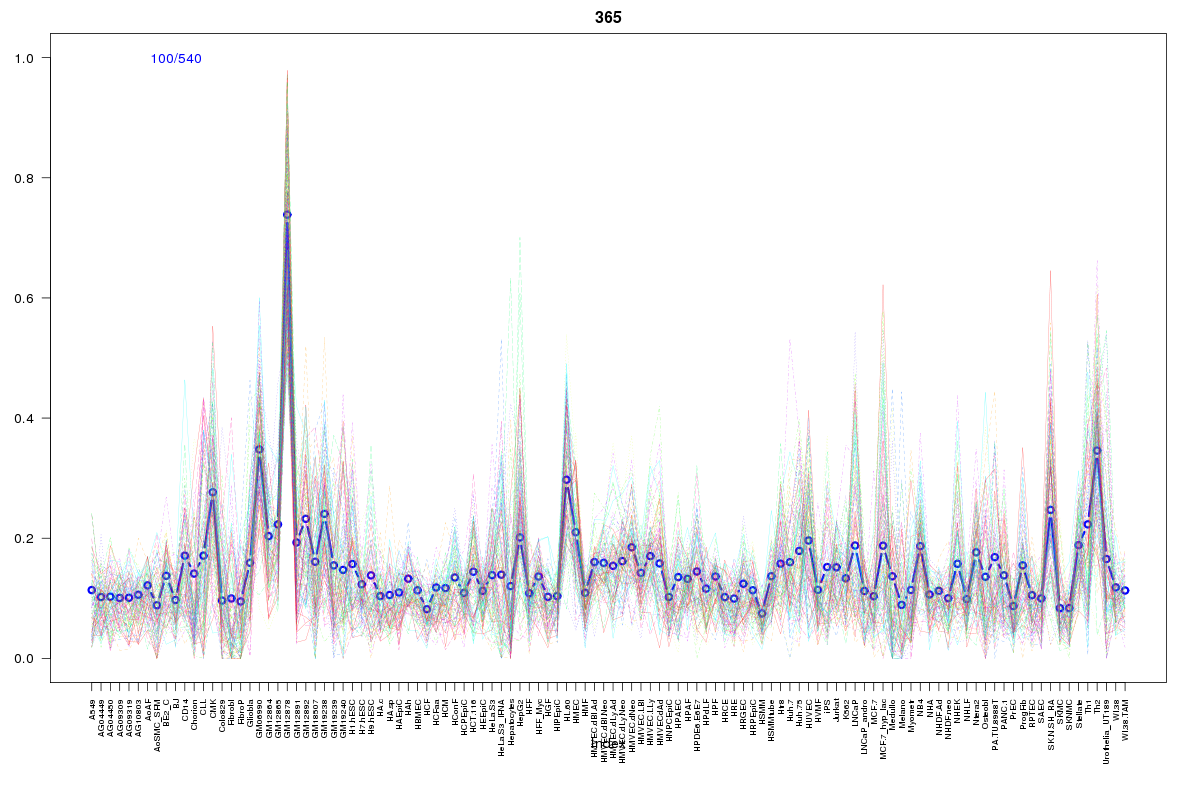
Cluster Hypersensitivity Profile

Genomic Location Trend
These plots show the distribution of the DHS sites surrounding the Transcript Start Site of the nearest gene.
Stats
Number of sites: 540Promoter: 36%
CpG-Island: 57%
Conserved: 51%
Enriched Motifs & Matches
Match Detail: [Jaspar]
|
| ||
|---|---|---|
| Sites: 66/100 | e-val: 8.5e-22 | ||
| Factor | e-val(match) | DB |
| SP1 | 0.0000000016036 | JASPAR |
| Pax4 | 0.000034191 | JASPAR |
| TFAP2A | 0.000050754 | JASPAR |
| Klf4 | 0.00021741 | JASPAR |
| RREB1 | 0.00039478 | JASPAR |
|
| ||
| Sites: 44/100 | e-val: 0.00049 | ||
| Factor | e-val(match) | DB |
| SP1 | 0.0001377 | JASPAR |
| TFAP2A | 0.00043498 | JASPAR |
| Tal1::Gata1 | 0.011047 | JASPAR |
| PPARG | 0.014321 | JASPAR |
| Zfx | 0.040104 | JASPAR |
BED file downloads
Top 10 Example Regions
| Location | Gene Link | Dist. |
|---|---|---|
| chr1: 150551305-150551455 | TARS2 | 30.02 |
| chr1: 150551305-150551455 | ADAMTSL4 | 30.02 |
| chr1: 150551305-150551455 | ENSA | 30.02 |
| chr1: 153700860-153701010 | S100A13 | 33.91 |
| chr16: 81813400-81813550 | CMIP | 40.13 |
| chr16: 81813400-81813550 | PLCG2 | 40.13 |
| chr11: 118965120-118965270 | RP11-110I1.6 | 40.43 |
| chr1: 159892920-159893070 | SLAMF9 | 40.72 |
| chr1: 180124545-180124695 | QSOX1 | 50.61 |
| chr5: 175815205-175815355 | NOP16 | 50.64 |