SOM cluster: 375
Cluster Hypersensitivity Profile

Genomic Location Trend
These plots show the distribution of the DHS sites surrounding the Transcript Start Site of the nearest gene.
Stats
Number of sites: 118Promoter: 6%
CpG-Island: 2%
Conserved: 34%
Enriched Motifs & Matches
Match Detail: [Jaspar]

| ||
|---|---|---|
| Sites: 47/100 | e-val: 2.3e-23 | ||
| Factor | e-val(match) | DB |
| AP1 | 0.00000000075117 | JASPAR |
| NFE2L2 | 0.0000000009327 | JASPAR |
| NFE2L1::MafG | 0.00017869 | JASPAR |
| Pax2 | 0.0051368 | JASPAR |
| PBX1 | 0.011482 | JASPAR |

| ||
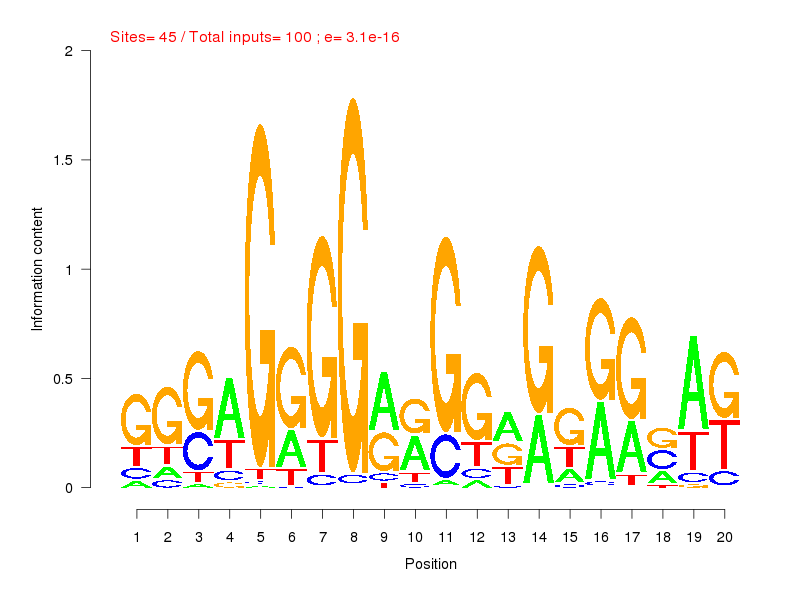
| Sites: 45/100 | e-val: 3.1e-16 | ||
| Factor | e-val(match) | DB |
| Pax4 | 0.00000056916 | JASPAR |
| SP1 | 0.0000094854 | JASPAR |
| EWSR1-FLI1 | 0.000010945 | JASPAR |
| RREB1 | 0.000067739 | JASPAR |
| MZF1_1-4 | 0.0032918 | JASPAR |
BED file downloads
Top 10 Example Regions
| Location | Gene Link | Dist. |
|---|---|---|
| chrX: 53342720-53342870 | RP6-29D12.4 | 45.04 |
| chr12: 13247420-13247570 | KIAA1467 | 45.92 |
| chr12: 13247420-13247570 | RP11-377D9.3 | 45.92 |
| chrX: 67905660-67905810 | STARD8 | 52.97 |
| chrX: 67905660-67905810 | ACTR3P2 | 52.97 |
| chrX: 53292380-53292530 | IQSEC2 | 53.08 |
| chr2: 185462440-185462590 | ZNF804A | 67.46 |
| chr2: 10438000-10438150 | HPCAL1 | 72.15 |
| chr14: 71350125-71350275 | PCNX | 76.96 |
| chr14: 71350125-71350275 | RP6-65G23.3 | 76.96 |