SOM cluster: 389
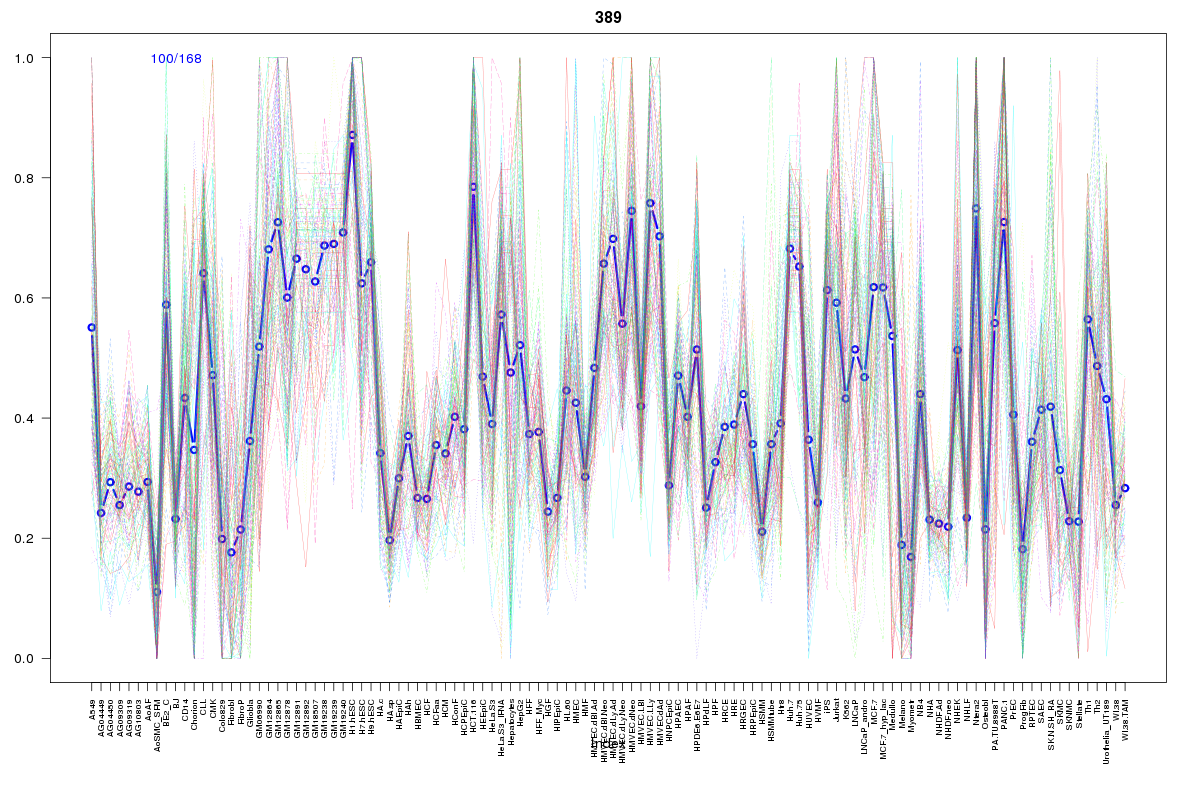
Cluster Hypersensitivity Profile

Genomic Location Trend
These plots show the distribution of the DHS sites surrounding the Transcript Start Site of the nearest gene.
Stats
Number of sites: 168Promoter: 6%
CpG-Island: 3%
Conserved: 58%
Enriched Motifs & Matches
Match Detail: [Jaspar]
|
| ||
|---|---|---|
| Sites: 81/100 | e-val: 0 | ||
| Factor | e-val(match) | DB |
| CTCF | 2.2204e-16 | JASPAR |
| INSM1 | 0.0000014595 | JASPAR |
| MYC::MAX | 0.00069331 | JASPAR |
| SP1 | 0.0012779 | JASPAR |
| Zfp423 | 0.0013115 | JASPAR |
|
| ||
| Sites: 49/100 | e-val: 1.4e-18 | ||
| Factor | e-val(match) | DB |
| ZEB1 | 0.000013061 | JASPAR |
| Myc | 0.000052046 | JASPAR |
| Mycn | 0.00007475 | JASPAR |
| T | 0.000080603 | JASPAR |
| MYC::MAX | 0.00010426 | JASPAR |
|
| ||
| Sites: 36/100 | e-val: 1.1 | ||
| Factor | e-val(match) | DB |
| SP1 | 0.0000018606 | JASPAR |
| Klf4 | 0.000031187 | JASPAR |
| TFAP2A | 0.00020493 | JASPAR |
| Pax4 | 0.0013192 | JASPAR |
| EBF1 | 0.001732 | JASPAR |
BED file downloads
Top 10 Example Regions
| Location | Gene Link | Dist. |
|---|---|---|
| chrX: 15756365-15756515 | CA5BP1 | 41.29 |
| chrX: 15756365-15756515 | ZRSR2 | 41.29 |
| chrX: 15756365-15756515 | AP1S2 | 41.29 |
| chr17: 3747360-3747510 | C17orf85 | 53.47 |
| chr17: 1533380-1533530 | MIR22HG | 56.31 |
| chr17: 1533380-1533530 | TLCD2 | 56.31 |
| chr6: 27280560-27280710 | PRSS16 | 56.75 |
| chr6: 27280560-27280710 | ZNF391 | 56.75 |
| chr15: 77376260-77376410 | PEAK1 | 59.77 |
| chr1: 182993080-182993230 | RP11-505O17.1 | 61.49 |