SOM cluster: 397
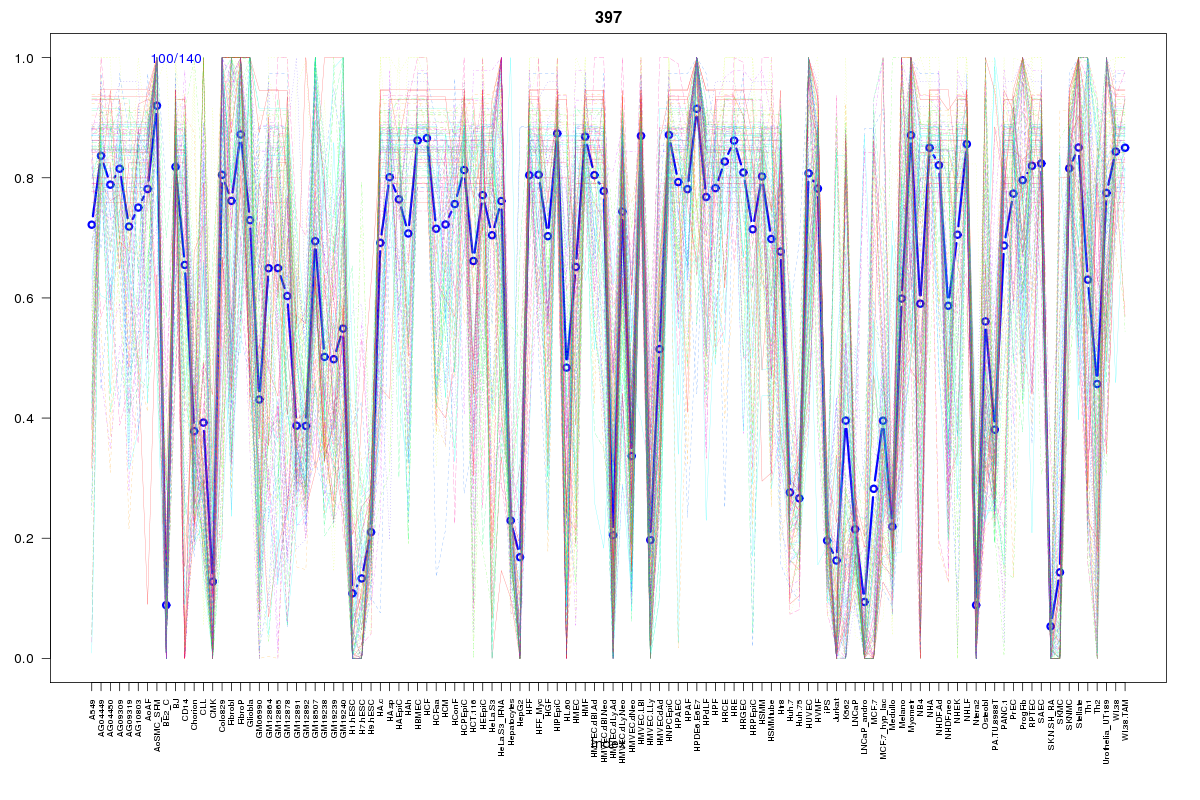
Cluster Hypersensitivity Profile

Genomic Location Trend
These plots show the distribution of the DHS sites surrounding the Transcript Start Site of the nearest gene.
Stats
Number of sites: 140Promoter: 6%
CpG-Island: 0%
Conserved: 61%
Enriched Motifs & Matches
Match Detail: [Jaspar]
|
| ||
|---|---|---|
| Sites: 72/100 | e-val: 0 | ||
| Factor | e-val(match) | DB |
| AP1 | 0.0000000014793 | JASPAR |
| NFE2L2 | 0.0000000092656 | JASPAR |
| NFE2L1::MafG | 0.00021063 | JASPAR |
| PBX1 | 0.0060449 | JASPAR |
| Pax2 | 0.03186 | JASPAR |
|
| ||
| Sites: 14/100 | e-val: 0.029 | ||
| Factor | e-val(match) | DB |
| Foxq1 | 0.000085632 | JASPAR |
| EWSR1-FLI1 | 0.0004299 | JASPAR |
| Sox2 | 0.0071255 | JASPAR |
| FOXI1 | 0.0084435 | JASPAR |
| Foxd3 | 0.0092188 | JASPAR |
BED file downloads
Top 10 Example Regions
| Location | Gene Link | Dist. |
|---|---|---|
| chr12: 120972980-120973130 | SRSF9 | 32.68 |
| chr8: 59508520-59508670 | SDCBP | 44.1 |
| chr1: 198638300-198638450 | RP11-553K8.2 | 47.61 |
| chr12: 27332880-27333030 | C12orf71 | 49.36 |
| chr11: 65047320-65047470 | POLA2 | 51.51 |
| chr11: 65047320-65047470 | CDC42EP2 | 51.51 |
| chr17: 71224960-71225110 | SSTR2 | 57.44 |
| chr17: 71224960-71225110 | CPSF4L | 57.44 |
| chr17: 71224960-71225110 | CDC42EP4 | 57.44 |
| chr9: 131710680-131710830 | DOLK | 60.36 |