SOM cluster: 399
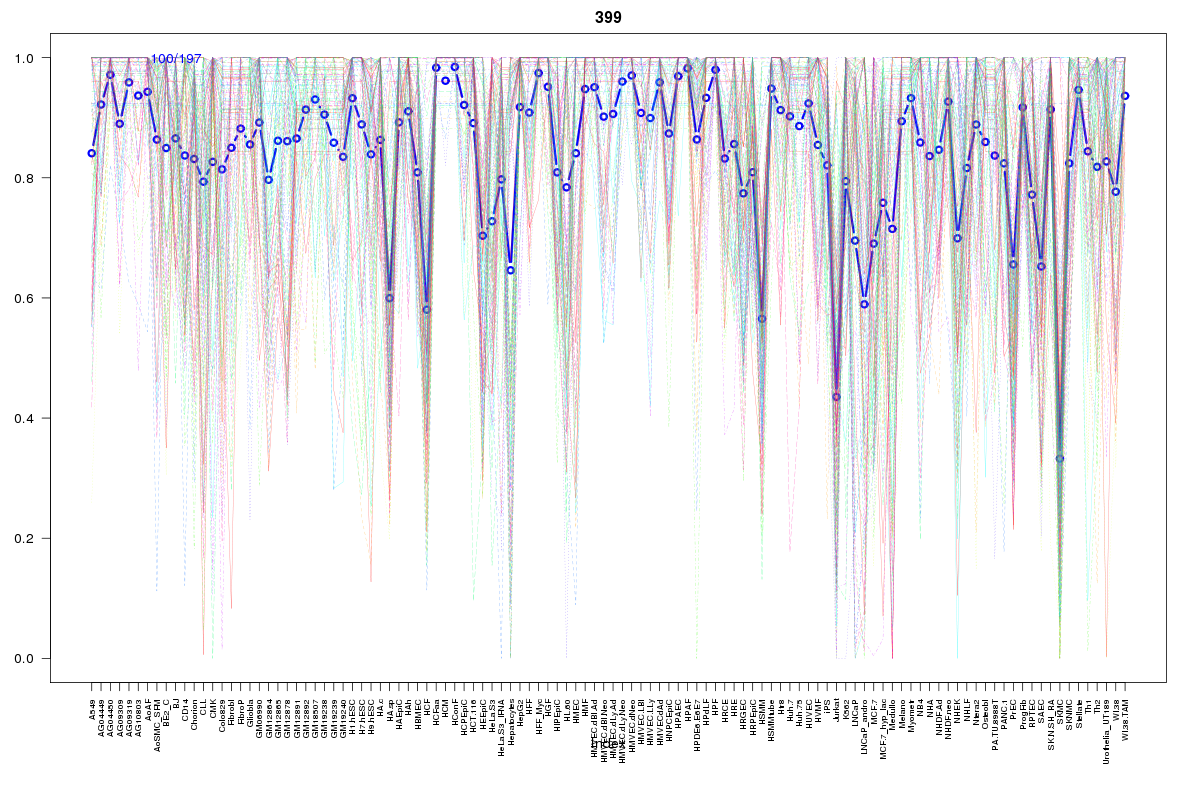
Cluster Hypersensitivity Profile

Genomic Location Trend
These plots show the distribution of the DHS sites surrounding the Transcript Start Site of the nearest gene.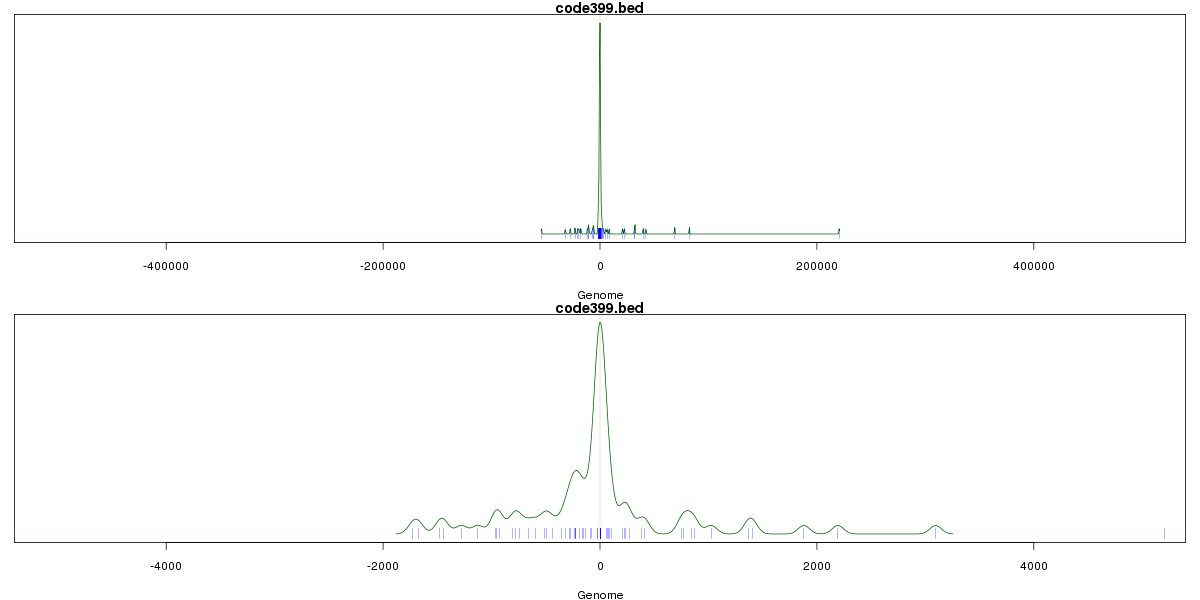
Stats
Number of sites: 197Promoter: 54%
CpG-Island: 67%
Conserved: 80%
Enriched Motifs & Matches
Match Detail: [Jaspar]
|
| ||
|---|---|---|
| Sites: 100/100 | e-val: 0 | ||
| Factor | e-val(match) | DB |
| SP1 | 0.00000014891 | JASPAR |
| Klf4 | 0.00000099686 | JASPAR |
| TFAP2A | 0.0027131 | JASPAR |
| RREB1 | 0.0032984 | JASPAR |
| Egr1 | 0.015465 | JASPAR |
|
| ||
| Sites: 89/100 | e-val: 1.2e-35 | ||
| Factor | e-val(match) | DB |
| SP1 | 0.0000050338 | JASPAR |
| TFAP2A | 0.000039392 | JASPAR |
| PLAG1 | 0.020016 | JASPAR |
| Zfp423 | 0.022104 | JASPAR |
| Pax5 | 0.031063 | JASPAR |
|
| ||
| Sites: 59/100 | e-val: 0.0000026 | ||
| Factor | e-val(match) | DB |
| SP1 | 0.0000044991 | JASPAR |
| Klf4 | 0.00009226 | JASPAR |
| Zfx | 0.0015275 | JASPAR |
| Egr1 | 0.0040323 | JASPAR |
| Pax4 | 0.031923 | JASPAR |
BED file downloads
Top 10 Example Regions
| Location | Gene Link | Dist. |
|---|---|---|
| chr19: 40927200-40927350 | PLD3 | 53.94 |
| chr22: 38453260-38453410 | POLR2F | 55.89 |
| chr19: 11877760-11877910 | ZNF441 | 61.25 |
| chr7: 106301680-106301830 | CTB-111H14.1 | 62.69 |
| chr11: 129939200-129939490 | ST14 | 63.07 |
| chr11: 129939200-129939490 | TCEB2P2 | 63.07 |
| chr19: 13958120-13958270 | CCDC130 | 66.53 |
| chr19: 13958120-13958270 | C19orf53 | 66.53 |
| chr19: 13958120-13958270 | C19orf57 | 66.53 |
| chr6: 27782560-27782710 | RSL24D1P1 | 68.1 |