SOM cluster: 40
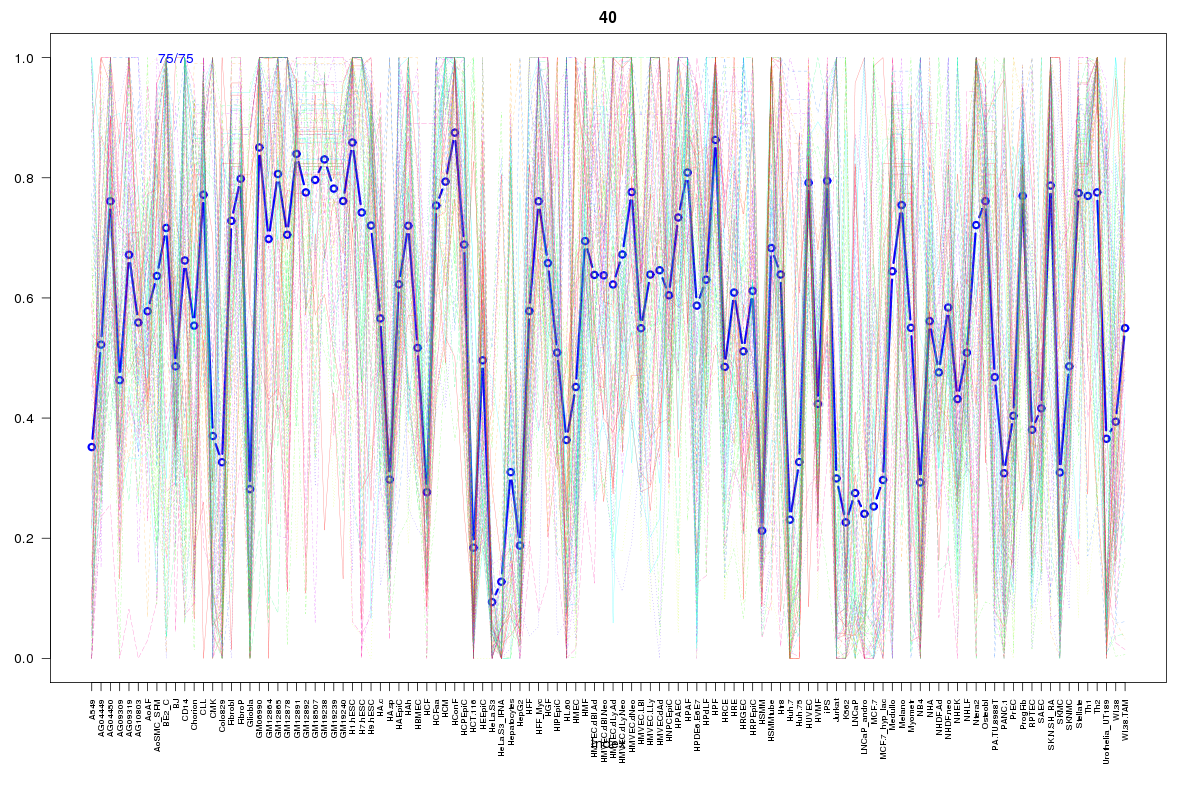
Cluster Hypersensitivity Profile

Genomic Location Trend
These plots show the distribution of the DHS sites surrounding the Transcript Start Site of the nearest gene.
Stats
Number of sites: 75Promoter: 43%
CpG-Island: 53%
Conserved: 51%
Enriched Motifs & Matches
Match Detail: [Jaspar]
|
| ||
|---|---|---|
| Sites: 64/75 | e-val: 1.8e-40 | ||
| Factor | e-val(match) | DB |
| SP1 | 0.0000000020935 | JASPAR |
| Klf4 | 0.000014901 | JASPAR |
| Egr1 | 0.00016195 | JASPAR |
| Zfx | 0.0025786 | JASPAR |
| TFAP2A | 0.0032419 | JASPAR |
|
| ||
| Sites: 68/75 | e-val: 0.054 | ||
| Factor | e-val(match) | DB |
| Egr1 | 0.00015154 | JASPAR |
| SP1 | 0.00025741 | JASPAR |
| TFAP2A | 0.0021874 | JASPAR |
| Klf4 | 0.0071067 | JASPAR |
| INSM1 | 0.065386 | JASPAR |
BED file downloads
Top 10 Example Regions
| Location | Gene Link | Dist. |
|---|---|---|
| chr1: 151103780-151103930 | PRUNE | 14.33 |
| chr1: 151103780-151103930 | TMOD4 | 14.33 |
| chr17: 48585760-48585910 | EPN3 | 55.73 |
| chr17: 48585760-48585910 | MYCBPAP | 55.73 |
| chr8: 98290160-98290310 | TSPYL5 | 56.91 |
| chr18: 47824380-47824530 | CCDC11 | 57.52 |
| chr9: 112810800-112810950 | AKAP2 | 57.61 |
| chr12: 121974160-121974310 | RNU6-1004P | 63.12 |
| chr11: 125366160-125366310 | EI24 | 65.72 |
| chr11: 125366160-125366310 | FEZ1 | 65.72 |