SOM cluster: 403
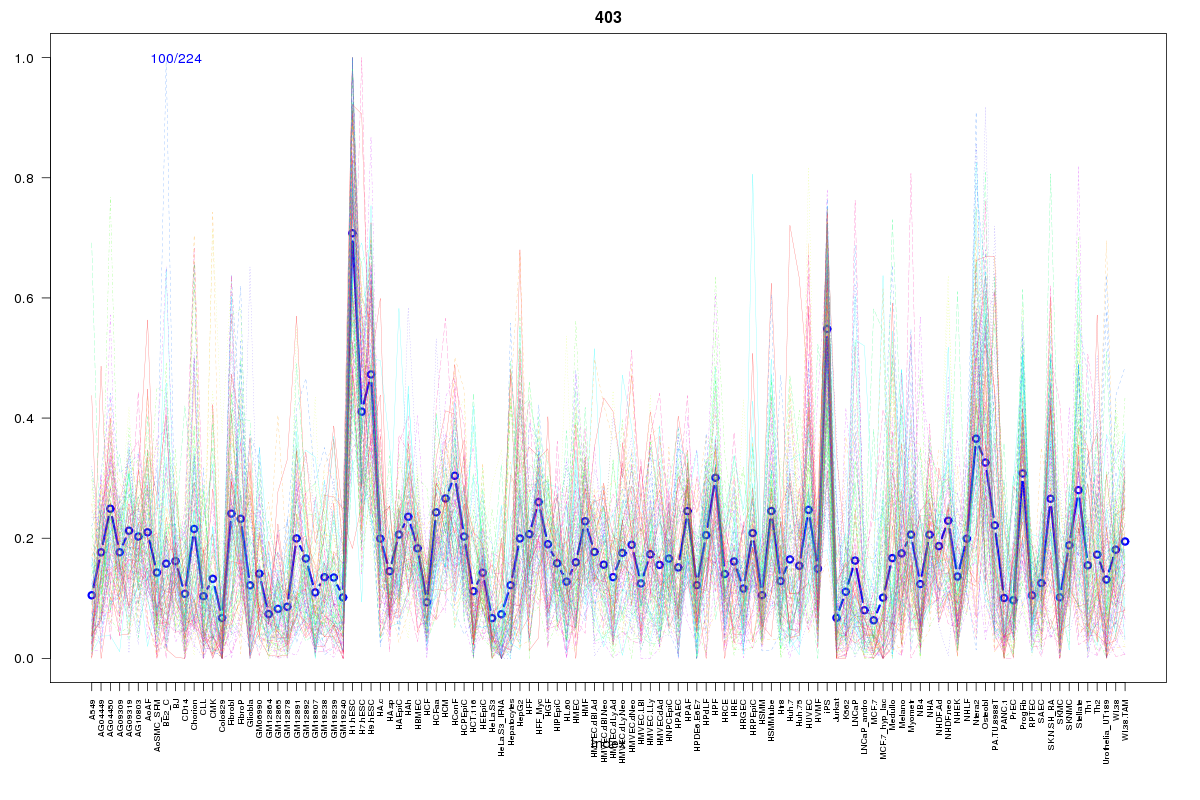
Cluster Hypersensitivity Profile

Genomic Location Trend
These plots show the distribution of the DHS sites surrounding the Transcript Start Site of the nearest gene.
Stats
Number of sites: 224Promoter: 17%
CpG-Island: 60%
Conserved: 53%
Enriched Motifs & Matches
Match Detail: [Jaspar]
|
| ||
|---|---|---|
| Sites: 94/100 | e-val: 0 | ||
| Factor | e-val(match) | DB |
| SP1 | 0.000019568 | JASPAR |
| PLAG1 | 0.0091172 | JASPAR |
| TFAP2A | 0.011504 | JASPAR |
| SPIB | 0.014078 | JASPAR |
| Klf4 | 0.019272 | JASPAR |
|
| ||
| Sites: 92/100 | e-val: 8.4e-30 | ||
| Factor | e-val(match) | DB |
| SP1 | 0.000058838 | JASPAR |
| EWSR1-FLI1 | 0.0047624 | JASPAR |
| Pax4 | 0.012681 | JASPAR |
| PLAG1 | 0.01308 | JASPAR |
| TFAP2A | 0.028289 | JASPAR |
BED file downloads
Top 10 Example Regions
| Location | Gene Link | Dist. |
|---|---|---|
| chr4: 8594325-8594475 | CPZ | 38.49 |
| chr4: 8594325-8594475 | GPR78 | 38.49 |
| chr9: 72658825-72658975 | MAMDC2 | 51.93 |
| chr1: 46669240-46669390 | LURAP1 | 58.55 |
| chr1: 46669240-46669390 | RP4-533D7.5 | 58.55 |
| chr1: 46669240-46669390 | RP11-322N21.2 | 58.55 |
| chr1: 46669240-46669390 | TSPAN1 | 58.55 |
| chr2: 160918905-160919055 | PLA2R1 | 59.51 |
| chr4: 174439040-174439190 | HAND2 | 59.82 |
| chr18: 56531600-56531750 | ZNF532 | 63.68 |