SOM cluster: 404
Cluster Hypersensitivity Profile

Genomic Location Trend
These plots show the distribution of the DHS sites surrounding the Transcript Start Site of the nearest gene.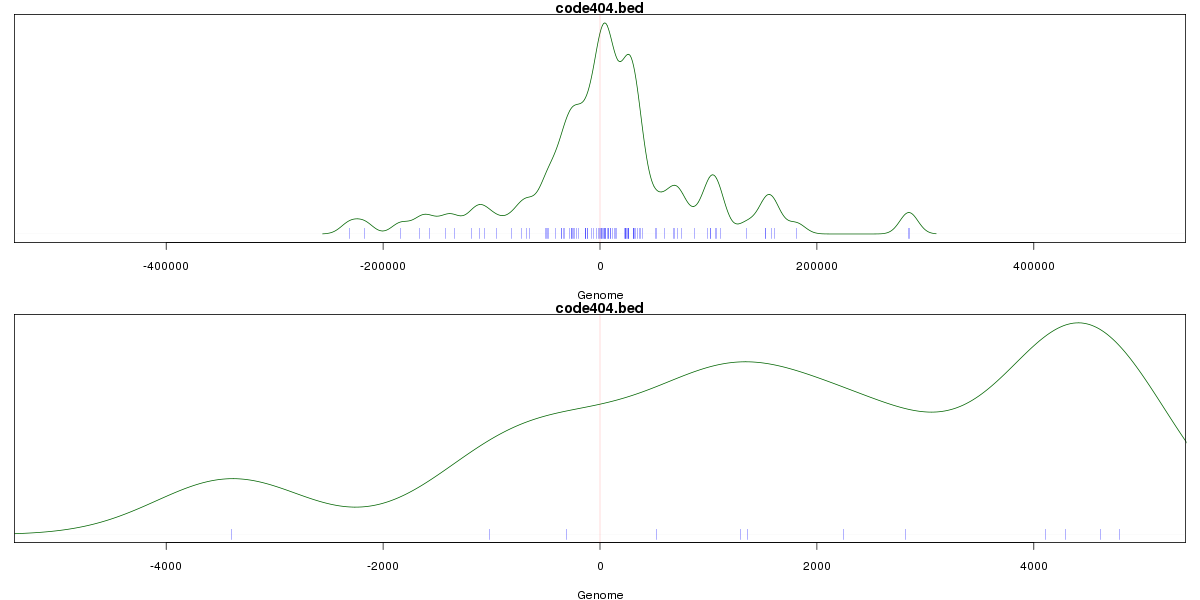
Stats
Number of sites: 288Promoter: 2%
CpG-Island: 7%
Conserved: 30%
Enriched Motifs & Matches
Match Detail: [Jaspar]
|
| ||
|---|---|---|
| Sites: 56/100 | e-val: 0 | ||
| Factor | e-val(match) | DB |
| CTCF | 0.00000000000028744 | JASPAR |
| INSM1 | 0.00000029178 | JASPAR |
| SP1 | 0.00056512 | JASPAR |
| Myf | 0.012318 | JASPAR |
| MZF1_5-13 | 0.015667 | JASPAR |
|
| ||
| Sites: 29/100 | e-val: 0.23 | ||
| Factor | e-val(match) | DB |
| SP1 | 0.0000000029857 | JASPAR |
| Klf4 | 0.0000026836 | JASPAR |
| RREB1 | 0.00010378 | JASPAR |
| INSM1 | 0.00035734 | JASPAR |
| Egr1 | 0.00077321 | JASPAR |
BED file downloads
Top 10 Example Regions
| Location | Gene Link | Dist. |
|---|---|---|
| chr17: 17897645-17897795 | TOM1L2 | 41.26 |
| chr12: 117910920-117911070 | KSR2 | 51.26 |
| chr19: 54402240-54402390 | CACNG7 | 55.17 |
| chr19: 11337940-11338090 | SPC24 | 60.67 |
| chr19: 55658140-55658290 | TNNT1 | 62.11 |
| chr19: 55658140-55658290 | TNNI3 | 62.11 |
| chr4: 6252240-6252390 | PPP2R2C | 68.55 |
| chr4: 158125860-158126010 | RNU6-582P | 69.56 |
| chr19: 20108580-20108730 | ZNF682 | 70.41 |
| chr19: 20108580-20108730 | ZNF90 | 70.41 |