SOM cluster: 419
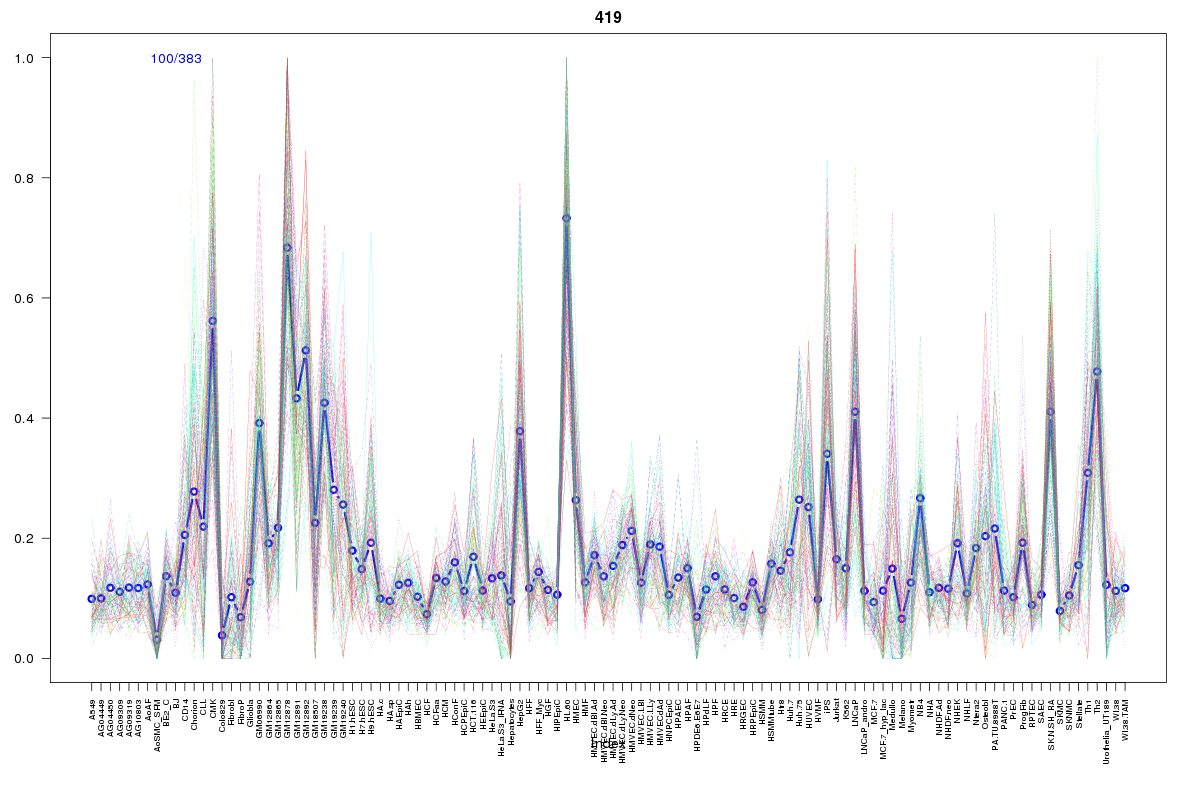
Cluster Hypersensitivity Profile

Genomic Location Trend
These plots show the distribution of the DHS sites surrounding the Transcript Start Site of the nearest gene.
Stats
Number of sites: 383Promoter: 22%
CpG-Island: 90%
Conserved: 61%
Enriched Motifs & Matches
Match Detail: [Jaspar]
|
| ||
|---|---|---|
| Sites: 98/100 | e-val: 0 | ||
| Factor | e-val(match) | DB |
| SP1 | 0.000000027429 | JASPAR |
| TFAP2A | 0.00027244 | JASPAR |
| Klf4 | 0.0017778 | JASPAR |
| Egr1 | 0.0020485 | JASPAR |
| Pax5 | 0.0025382 | JASPAR |
|
| ||
| Sites: 89/100 | e-val: 0 | ||
| Factor | e-val(match) | DB |
| SP1 | 0.000000010027 | JASPAR |
| TFAP2A | 0.0000037814 | JASPAR |
| PLAG1 | 0.0000045354 | JASPAR |
| Klf4 | 0.0048143 | JASPAR |
| Egr1 | 0.01846 | JASPAR |
|
| ||
| Sites: 53/100 | e-val: 0.000000000000041 | ||
| Factor | e-val(match) | DB |
| TFAP2A | 0.00012176 | JASPAR |
| PLAG1 | 0.0017336 | JASPAR |
| SP1 | 0.0026208 | JASPAR |
| Klf4 | 0.011764 | JASPAR |
| Zfx | 0.05583 | JASPAR |
BED file downloads
Top 10 Example Regions
| Location | Gene Link | Dist. |
|---|---|---|
| chr1: 150946700-150946850 | C1orf56 | 18.06 |
| chr1: 150946700-150946850 | CERS2 | 18.06 |
| chr12: 108909220-108909370 | SART3 | 38.24 |
| chr12: 108909220-108909370 | TMEM119 | 38.24 |
| chr10: 99186220-99186370 | AL355490.1 | 47.42 |
| chr2: 73511140-73511290 | NOTO | 48.93 |
| chr2: 73511140-73511290 | CCT7 | 48.93 |
| chr17: 38278985-38279135 | THRA | 50.81 |
| chr17: 38278985-38279135 | NR1D1 | 50.81 |
| chr17: 38278985-38279135 | MED24 | 50.81 |