SOM cluster: 420
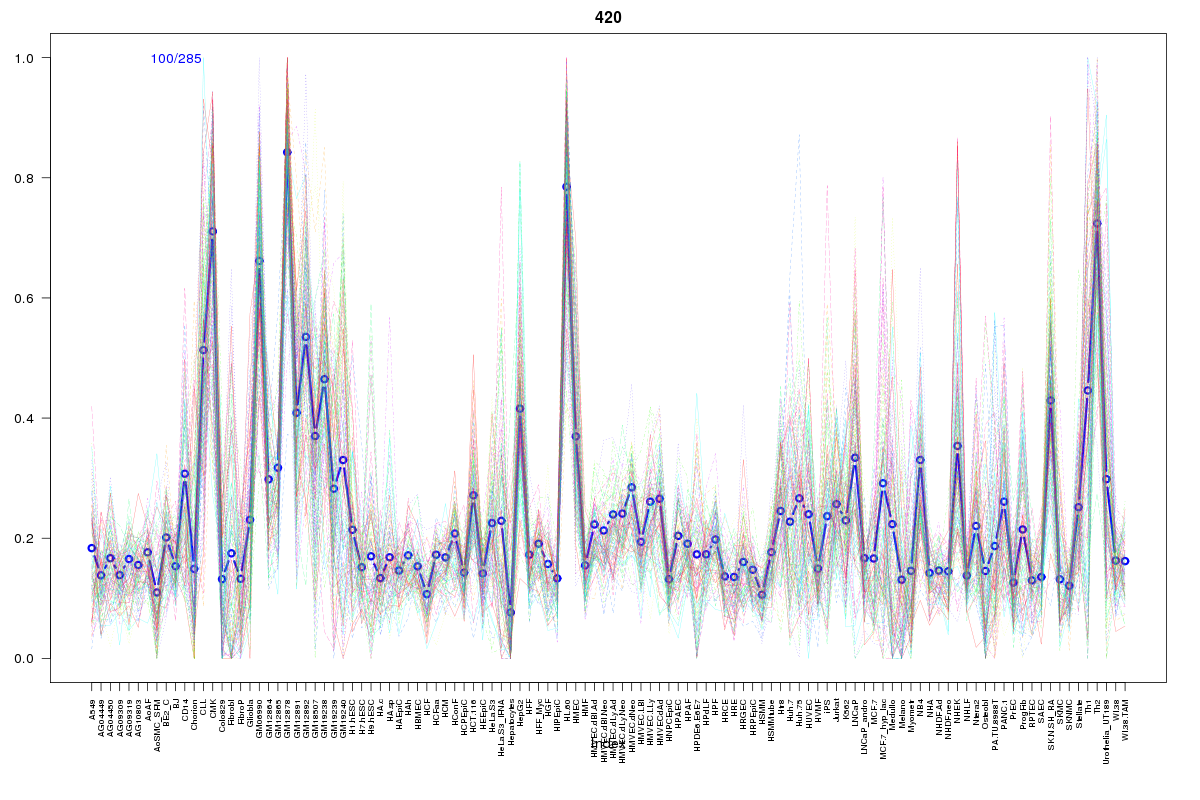
Cluster Hypersensitivity Profile

Genomic Location Trend
These plots show the distribution of the DHS sites surrounding the Transcript Start Site of the nearest gene.
Stats
Number of sites: 285Promoter: 33%
CpG-Island: 83%
Conserved: 60%
Enriched Motifs & Matches
Match Detail: [Jaspar]
|
| ||
|---|---|---|
| Sites: 98/100 | e-val: 0 | ||
| Factor | e-val(match) | DB |
| SP1 | 0.0000037805 | JASPAR |
| TFAP2A | 0.00082319 | JASPAR |
| RREB1 | 0.0019821 | JASPAR |
| PLAG1 | 0.0056116 | JASPAR |
| Klf4 | 0.0070986 | JASPAR |
BED file downloads
Top 10 Example Regions
| Location | Gene Link | Dist. |
|---|---|---|
| chr1: 182758545-182758695 | RP11-317P15.3 | 41.39 |
| chr9: 132597300-132597450 | UBE2V1P4 | 45.41 |
| chr9: 132597300-132597450 | FNBP1 | 45.41 |
| chr19: 48836665-48836815 | CARD8 | 47.75 |
| chr19: 48836665-48836815 | TMEM143 | 47.75 |
| chr19: 48836665-48836815 | KDELR1 | 47.75 |
| chr1: 11333665-11333815 | UBIAD1 | 51.83 |
| chr11: 67159025-67159175 | RN7SKP239 | 52.42 |
| chr11: 67159025-67159175 | ANKRD13D | 52.42 |
| chr11: 67159025-67159175 | PTPRCAP | 52.42 |