SOM cluster: 43
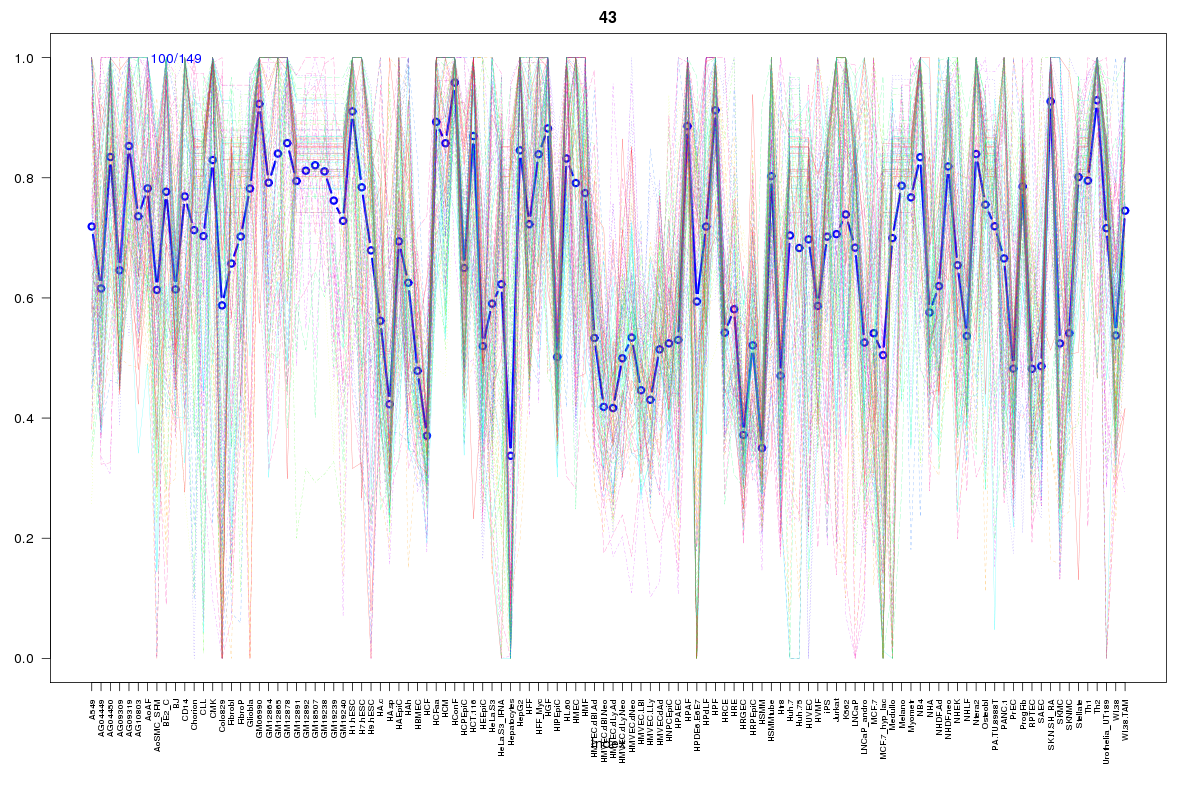
Cluster Hypersensitivity Profile

Genomic Location Trend
These plots show the distribution of the DHS sites surrounding the Transcript Start Site of the nearest gene.
Stats
Number of sites: 149Promoter: 50%
CpG-Island: 77%
Conserved: 64%
Enriched Motifs & Matches
Match Detail: [Jaspar]
|
| ||
|---|---|---|
| Sites: 94/100 | e-val: 0 | ||
| Factor | e-val(match) | DB |
| SP1 | 0.0000000049217 | JASPAR |
| PLAG1 | 0.000099365 | JASPAR |
| TFAP2A | 0.00021781 | JASPAR |
| Klf4 | 0.00026097 | JASPAR |
| RREB1 | 0.00051311 | JASPAR |
|
| ||
| Sites: 62/100 | e-val: 8.7e-31 | ||
| Factor | e-val(match) | DB |
| EWSR1-FLI1 | 0.00000043503 | JASPAR |
| SP1 | 0.000034325 | JASPAR |
| PLAG1 | 0.016148 | JASPAR |
| TFAP2A | 0.017586 | JASPAR |
| Klf4 | 0.04453 | JASPAR |
|
| ||
| Sites: 55/100 | e-val: 0.19 | ||
| Factor | e-val(match) | DB |
| SP1 | 0.00000010643 | JASPAR |
| TFAP2A | 0.00000016615 | JASPAR |
| Klf4 | 0.000002659 | JASPAR |
| RREB1 | 0.000068659 | JASPAR |
| Egr1 | 0.0015417 | JASPAR |
BED file downloads
Top 10 Example Regions
| Location | Gene Link | Dist. |
|---|---|---|
| chr9: 117160180-117160330 | AKNA | 40.67 |
| chr9: 117160180-117160330 | RP11-9M16.2 | 40.67 |
| chr17: 72209440-72209590 | TTYH2 | 47.92 |
| chr10: 91404980-91405130 | RP11-80H5.7 | 49.23 |
| chr16: 89984320-89984470 | DBNDD1 | 51.96 |
| chr16: 89984320-89984470 | TCF25 | 51.96 |
| chr16: 89984320-89984470 | AFG3L1P | 51.96 |
| chr11: 64949200-64949350 | TMEM262 | 52.33 |
| chr2: 97534400-97534550 | CNNM4 | 53.21 |
| chr2: 97534400-97534550 | ANKRD39 | 53.21 |