SOM cluster: 449
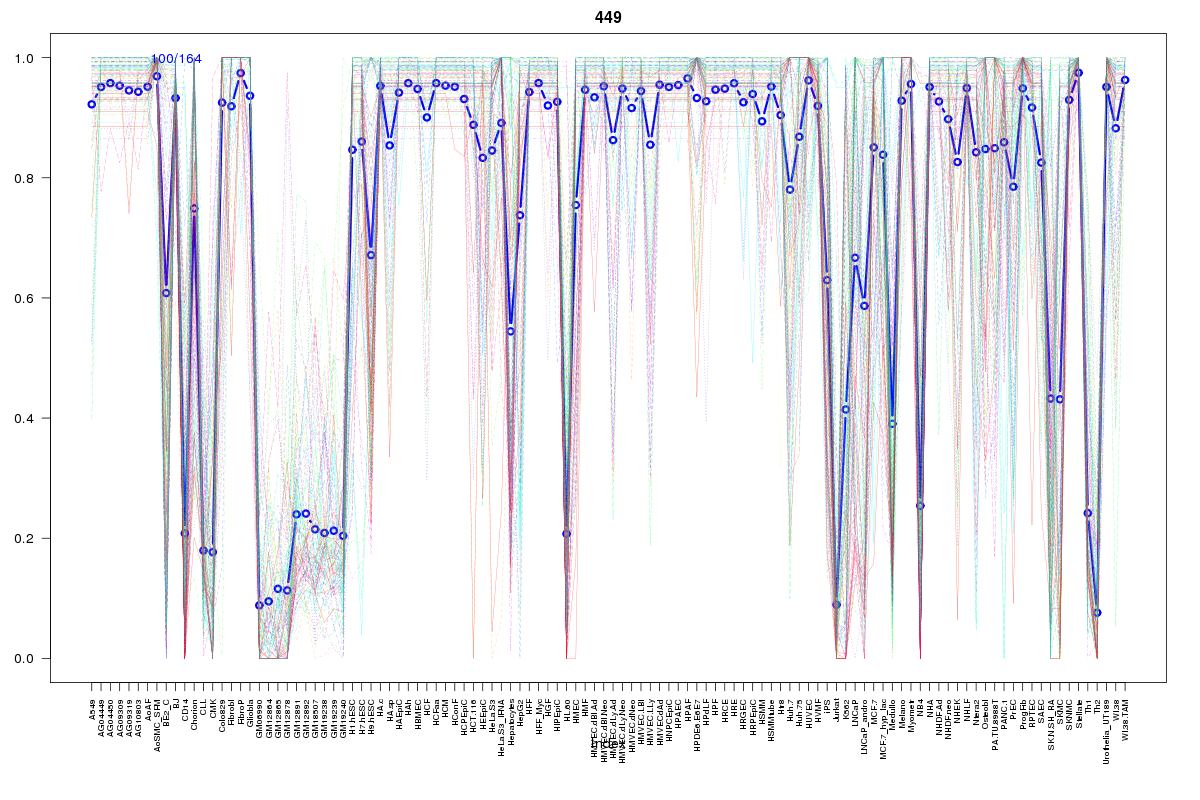
Cluster Hypersensitivity Profile

Genomic Location Trend
These plots show the distribution of the DHS sites surrounding the Transcript Start Site of the nearest gene.
Stats
Number of sites: 164Promoter: 23%
CpG-Island: 15%
Conserved: 80%
Enriched Motifs & Matches
Match Detail: [Jaspar]
|
| ||
|---|---|---|
| Sites: 36/100 | e-val: 2.2e-22 | ||
| Factor | e-val(match) | DB |
| AP1 | 0.00000023527 | JASPAR |
| NFE2L2 | 0.00000065899 | JASPAR |
| INSM1 | 0.0074687 | JASPAR |
| TFAP2A | 0.0094995 | JASPAR |
| TEAD1 | 0.021048 | JASPAR |
|
| ||
| Sites: 47/100 | e-val: 1.6e-16 | ||
| Factor | e-val(match) | DB |
| TEAD1 | 0.000000000043172 | JASPAR |
| FEV | 0.000019664 | JASPAR |
| Stat3 | 0.00014342 | JASPAR |
| NF-kappaB | 0.00051233 | JASPAR |
| SPIB | 0.00051658 | JASPAR |
|
| ||
| Sites: 91/100 | e-val: 0.00000000026 | ||
| Factor | e-val(match) | DB |
| SP1 | 0.000036788 | JASPAR |
| Myf | 0.00036601 | JASPAR |
| Tal1::Gata1 | 0.0013282 | JASPAR |
| ESR1 | 0.015132 | JASPAR |
| NHLH1 | 0.016224 | JASPAR |