SOM cluster: 456
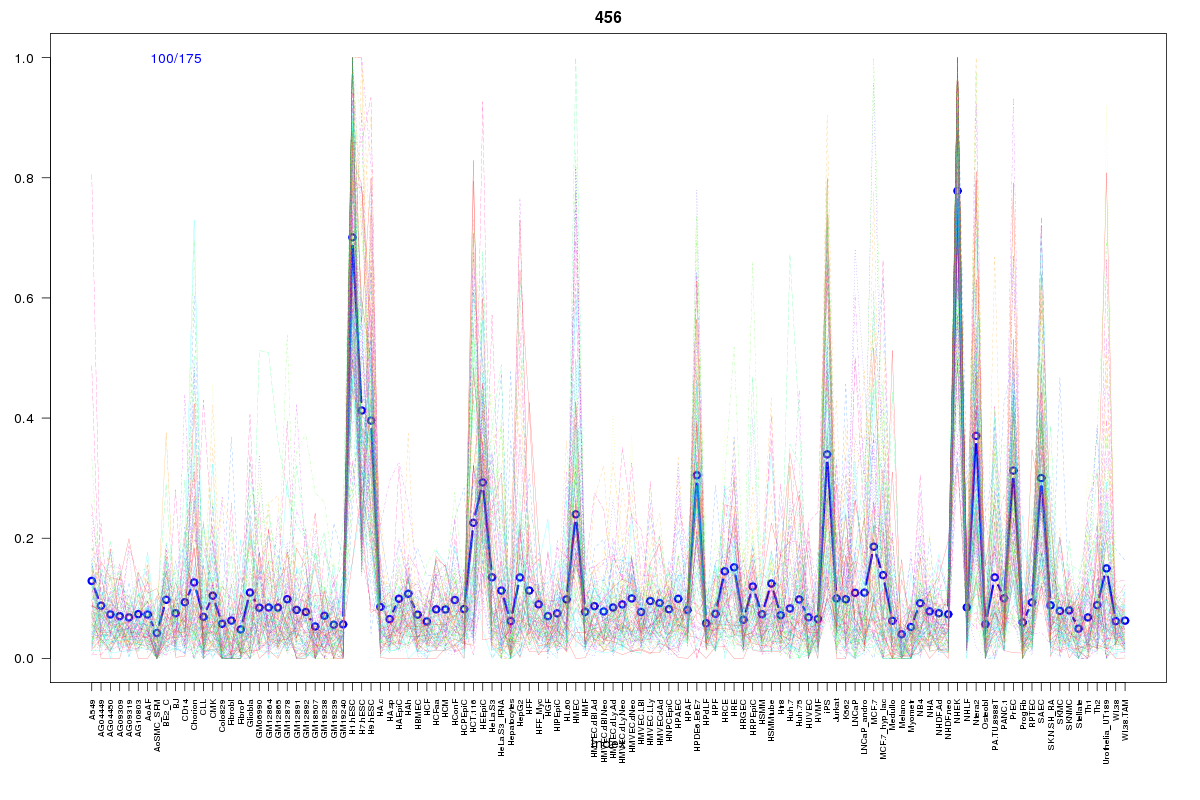
Cluster Hypersensitivity Profile

Genomic Location Trend
These plots show the distribution of the DHS sites surrounding the Transcript Start Site of the nearest gene.
Stats
Number of sites: 175Promoter: 13%
CpG-Island: 10%
Conserved: 39%
Enriched Motifs & Matches
Match Detail: [Jaspar]
|
| ||
|---|---|---|
| Sites: 55/100 | e-val: 7.1e-18 | ||
| Factor | e-val(match) | DB |
| EWSR1-FLI1 | 0.0000059306 | JASPAR |
| RREB1 | 0.000021453 | JASPAR |
| SP1 | 0.000038872 | JASPAR |
| Pax4 | 0.0013629 | JASPAR |
| Egr1 | 0.014939 | JASPAR |
|
| ||
| Sites: 34/100 | e-val: 0.0000088 | ||
| Factor | e-val(match) | DB |
| SP1 | 0.000000000075556 | JASPAR |
| Klf4 | 0.0000001446 | JASPAR |
| Tal1::Gata1 | 0.00010786 | JASPAR |
| MZF1_1-4 | 0.0013263 | JASPAR |
| Pax4 | 0.0036232 | JASPAR |
|
| ||
| Sites: 26/100 | e-val: 1.9 | ||
| Factor | e-val(match) | DB |
| REST | 0.00056862 | JASPAR |
| Myf | 0.0062347 | JASPAR |
| SP1 | 0.01156 | JASPAR |
| Pax4 | 0.013723 | JASPAR |
| RREB1 | 0.032012 | JASPAR |
BED file downloads
Top 10 Example Regions
| Location | Gene Link | Dist. |
|---|---|---|
| chr1: 203018005-203018155 | RP11-335O13.8 | 46.54 |
| chr17: 48058160-48058310 | RP11-1094H24.4 | 50.95 |
| chr17: 48058325-48058475 | RP11-1094H24.3 | 51.49 |
| chr19: 51504320-51504470 | CTU1 | 59.52 |
| chr19: 51504320-51504470 | KLK13 | 59.52 |
| chr19: 51504320-51504470 | KLK14 | 59.52 |
| chr16: 87520985-87521135 | ZCCHC14 | 64.77 |
| chr12: 53892540-53892690 | RP11-793H13.3 | 64.96 |
| chr19: 46524825-46524975 | IGFL4 | 66.86 |
| chr1: 33226480-33226630 | KIAA1522 | 68.89 |