SOM cluster: 46
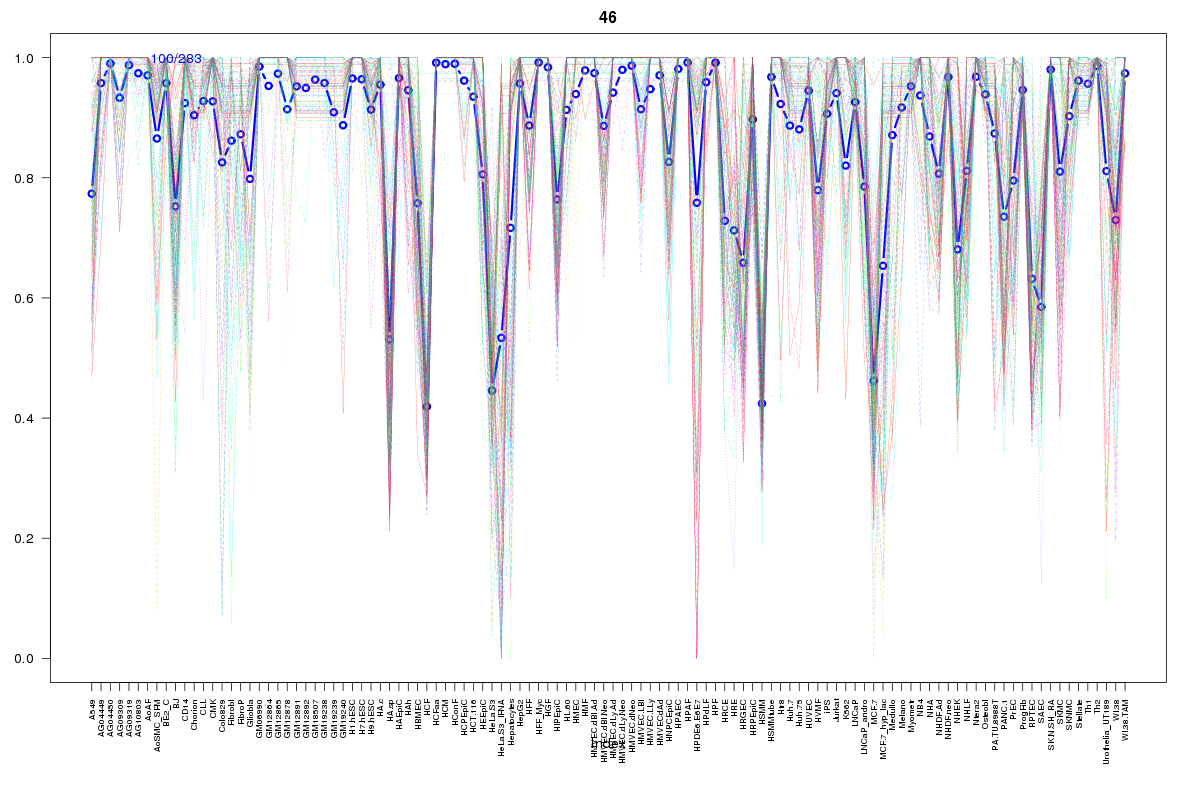
Cluster Hypersensitivity Profile

Genomic Location Trend
These plots show the distribution of the DHS sites surrounding the Transcript Start Site of the nearest gene.
Stats
Number of sites: 283Promoter: 85%
CpG-Island: 92%
Conserved: 91%
Enriched Motifs & Matches
Match Detail: [Jaspar]
|
| ||
|---|---|---|
| Sites: 95/100 | e-val: 0 | ||
| Factor | e-val(match) | DB |
| SP1 | 0.0000000052218 | JASPAR |
| Egr1 | 0.0017658 | JASPAR |
| TFAP2A | 0.0037805 | JASPAR |
| Klf4 | 0.0058342 | JASPAR |
| PLAG1 | 0.0067909 | JASPAR |
|
| ||
| Sites: 83/100 | e-val: 1.20512e-43 | ||
| Factor | e-val(match) | DB |
| SP1 | 0.00054137 | JASPAR |
| NHLH1 | 0.00099783 | JASPAR |
| TFAP2A | 0.0024002 | JASPAR |
| Egr1 | 0.039254 | JASPAR |
| PLAG1 | 0.084867 | JASPAR |
|
| ||
| Sites: 72/100 | e-val: 2.2e-19 | ||
| Factor | e-val(match) | DB |
| SP1 | 0.00000000068251 | JASPAR |
| Pax4 | 0.0020284 | JASPAR |
| Tal1::Gata1 | 0.002413 | JASPAR |
| EWSR1-FLI1 | 0.010901 | JASPAR |
| PLAG1 | 0.012733 | JASPAR |
BED file downloads
Top 10 Example Regions
| Location | Gene Link | Dist. |
|---|---|---|
| chr8: 54934940-54935090 | RGS20 | 34.86 |
| chr1: 1209220-1209370 | PUSL1 | 47.38 |
| chr16: 12897700-12897850 | CPPED1 | 49.4 |
| chr2: 169312600-169312750 | CERS6 | 49.66 |
| chr17: 18128700-18128850 | MIEF2 | 52.39 |
| chr17: 18128700-18128850 | ALKBH5 | 52.39 |
| chr19: 51161460-51161610 | CLEC11A | 54.05 |
| chr11: 65626820-65626970 | OVOL1 | 55.12 |
| chr19: 14317660-14317810 | ASF1B | 58.04 |
| chr11: 64038880-64039030 | RPS6KA4 | 59.45 |