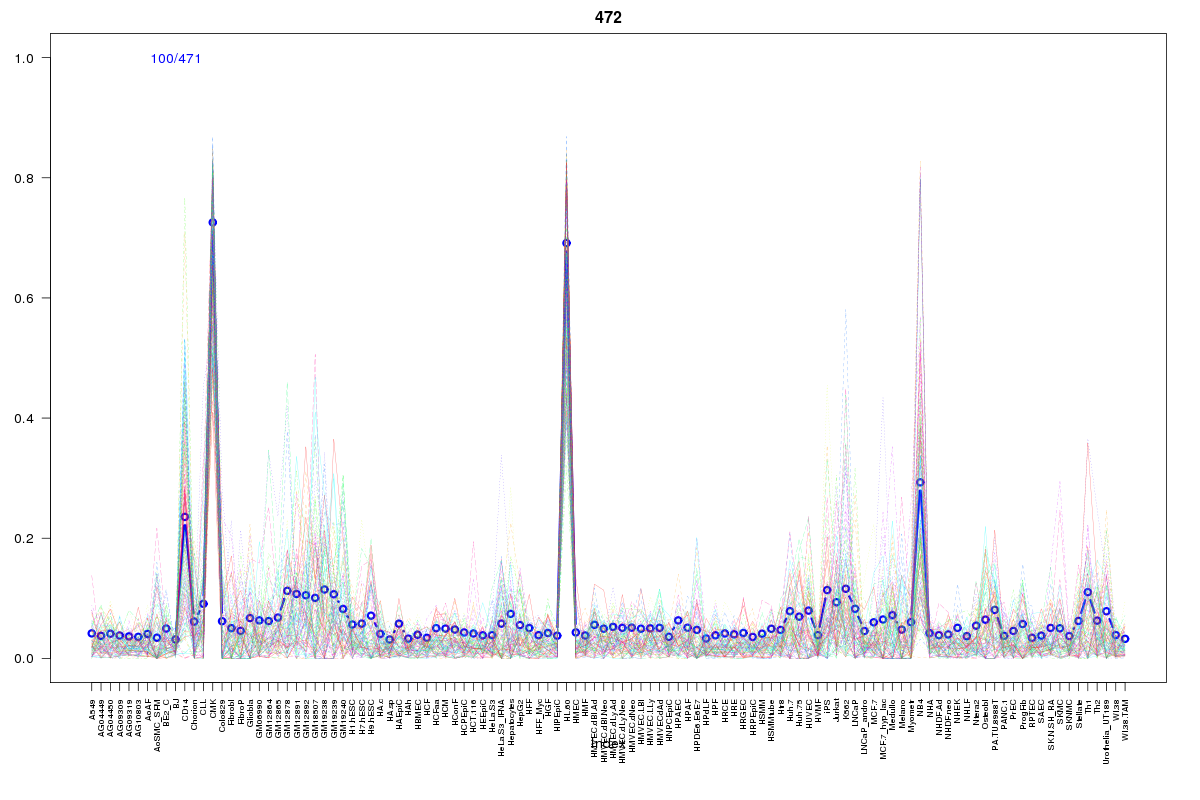
SOM cluster: 472
Cluster Hypersensitivity Profile

Genomic Location Trend
These plots show the distribution of the DHS sites surrounding the Transcript Start Site of the nearest gene.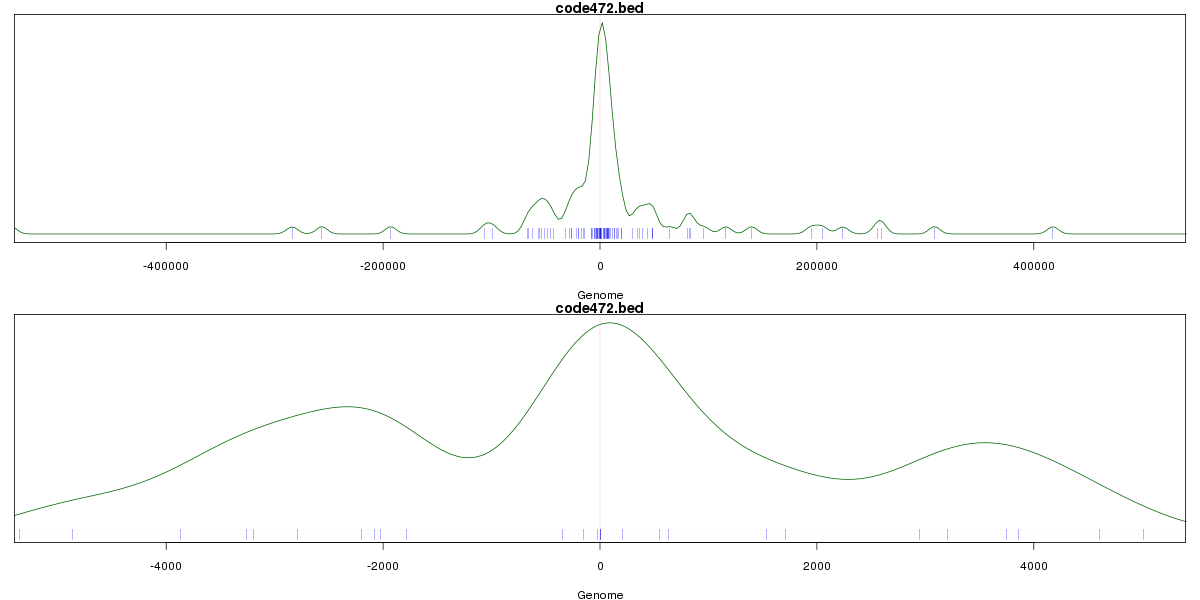
Stats
Number of sites: 471Promoter: 9%
CpG-Island: 0%
Conserved: 18%
Enriched Motifs & Matches
Match Detail: [Jaspar]
|
| ||
|---|---|---|
| Sites: 35/100 | e-val: 0.000000000053 | ||
| Factor | e-val(match) | DB |
| SPI1 | 0.0000019069 | JASPAR |
| SP1 | 0.0000092168 | JASPAR |
| SPIB | 0.000041481 | JASPAR |
| Pax4 | 0.00034839 | JASPAR |
| FEV | 0.0011143 | JASPAR |
BED file downloads
Top 10 Example Regions
| Location | Gene Link | Dist. |
|---|---|---|
| chr6: 31555520-31555670 | C6orf47-AS1 | 39.85 |
| chr3: 47418820-47418970 | PTPN23 | 45.14 |
| chrX: 55740700-55740850 | RRAGB | 48.14 |
| chr3: 195921140-195921290 | PCYT1A | 54.43 |
| chr1: 200611700-200611850 | CAMSAP2 | 54.73 |
| chr22: 22294060-22294210 | MAPK1 | 58.17 |
| chr4: 6754300-6754450 | AC093323.3 | 58.75 |
| chr4: 6754300-6754450 | RP11-539L10.2 | 58.75 |
| chr4: 827140-827290 | RP11-440L14.1 | 59.87 |
| chr4: 827140-827290 | PCGF3 | 59.87 |