SOM cluster: 474
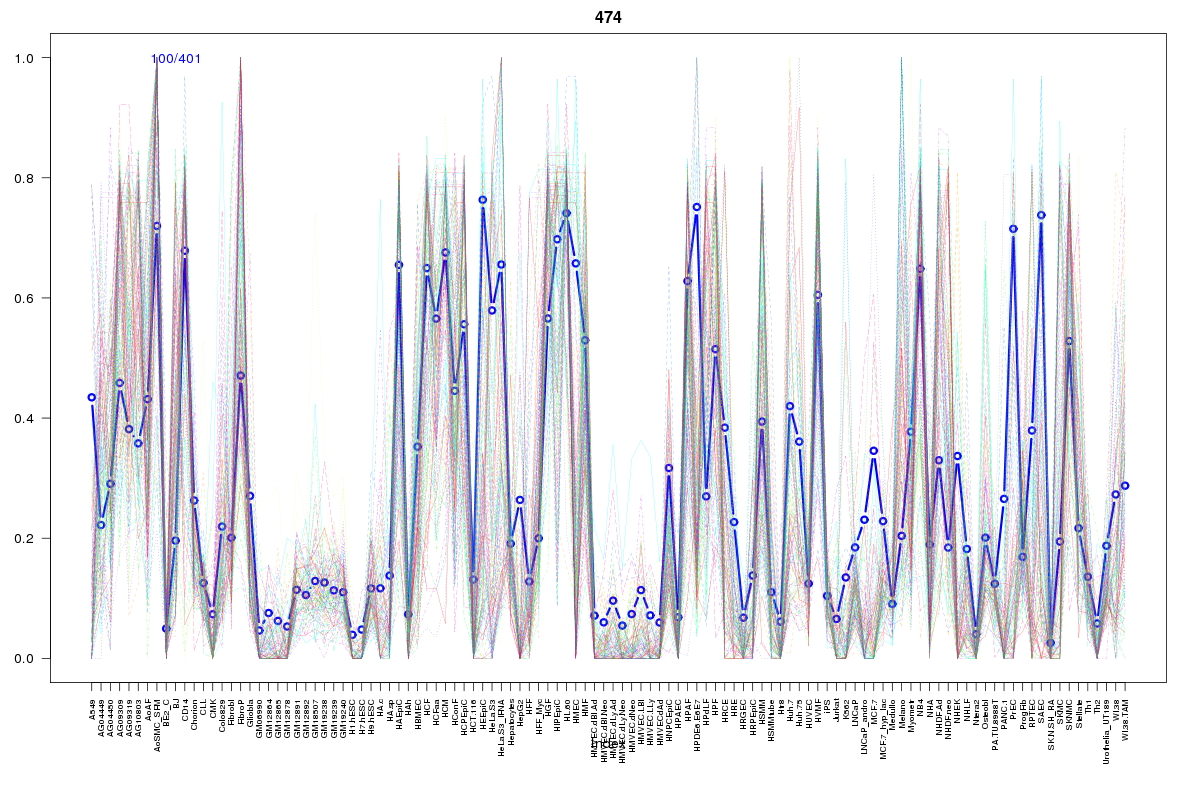
Cluster Hypersensitivity Profile

Genomic Location Trend
These plots show the distribution of the DHS sites surrounding the Transcript Start Site of the nearest gene.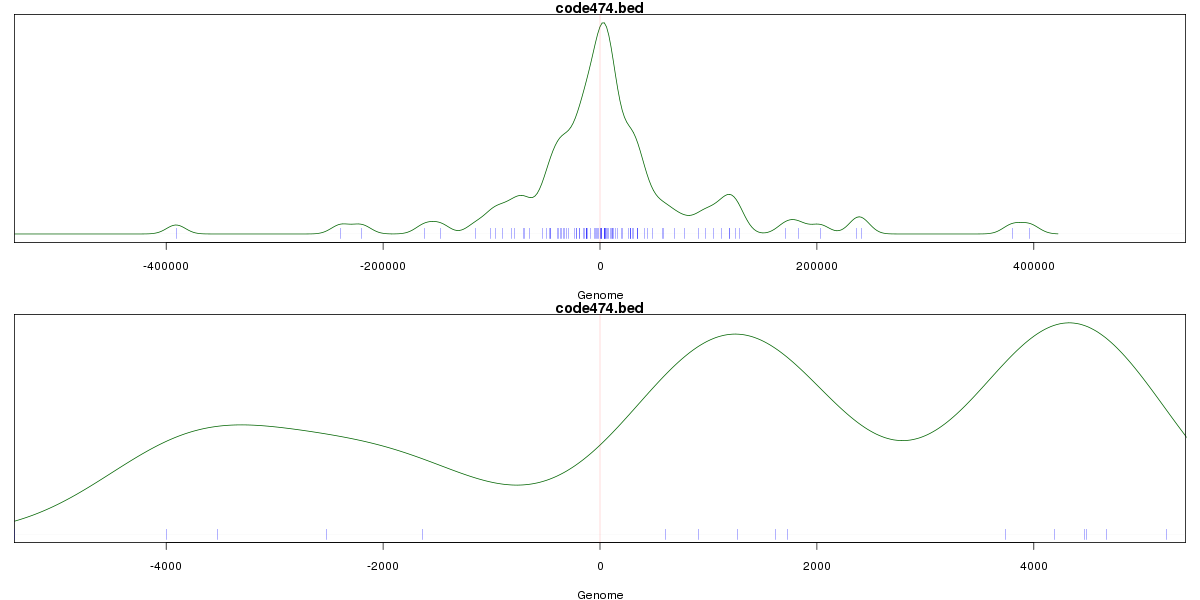
Stats
Number of sites: 401Promoter: 1%
CpG-Island: 0%
Conserved: 37%
Enriched Motifs & Matches
Match Detail: [Jaspar]
|
| ||
|---|---|---|
| Sites: 67/100 | e-val: 1.2e-23 | ||
| Factor | e-val(match) | DB |
| CEBPA | 0.0000000072535 | JASPAR |
| HLF | 0.00061022 | JASPAR |
| NFIL3 | 0.0015551 | JASPAR |
| NFATC2 | 0.0024028 | JASPAR |
| Ddit3::Cebpa | 0.0093002 | JASPAR |
|
| ||
| Sites: 31/100 | e-val: 0.0000003 | ||
| Factor | e-val(match) | DB |
| CEBPA | 0.00000011138 | JASPAR |
| Pou5f1 | 0.00000066552 | JASPAR |
| Sox2 | 0.000001822 | JASPAR |
| HLF | 0.0000038484 | JASPAR |
| NFIL3 | 0.00033668 | JASPAR |
BED file downloads
Top 10 Example Regions
| Location | Gene Link | Dist. |
|---|---|---|
| chr18: 57057040-57057190 | CCBE1 | 40.09 |
| chr9: 117614540-117614690 | TNFSF15 | 42.86 |
| chr16: 28545880-28546030 | NUPR1 | 44.55 |
| chr1: 183213760-183213910 | LAMC2 | 48.36 |
| chr1: 183213760-183213910 | RP11-548N1.1 | 48.36 |
| chr6: 119441220-119441370 | FAM184A | 51.09 |
| chr13: 32699600-32699750 | FRY | 53.14 |
| chr7: 87936200-87936350 | STEAP4 | 55.04 |
| chr7: 87936200-87936350 | AC003991.3 | 55.04 |
| chr13: 50797020-50797170 | ST13P4 | 56.15 |