SOM cluster: 493
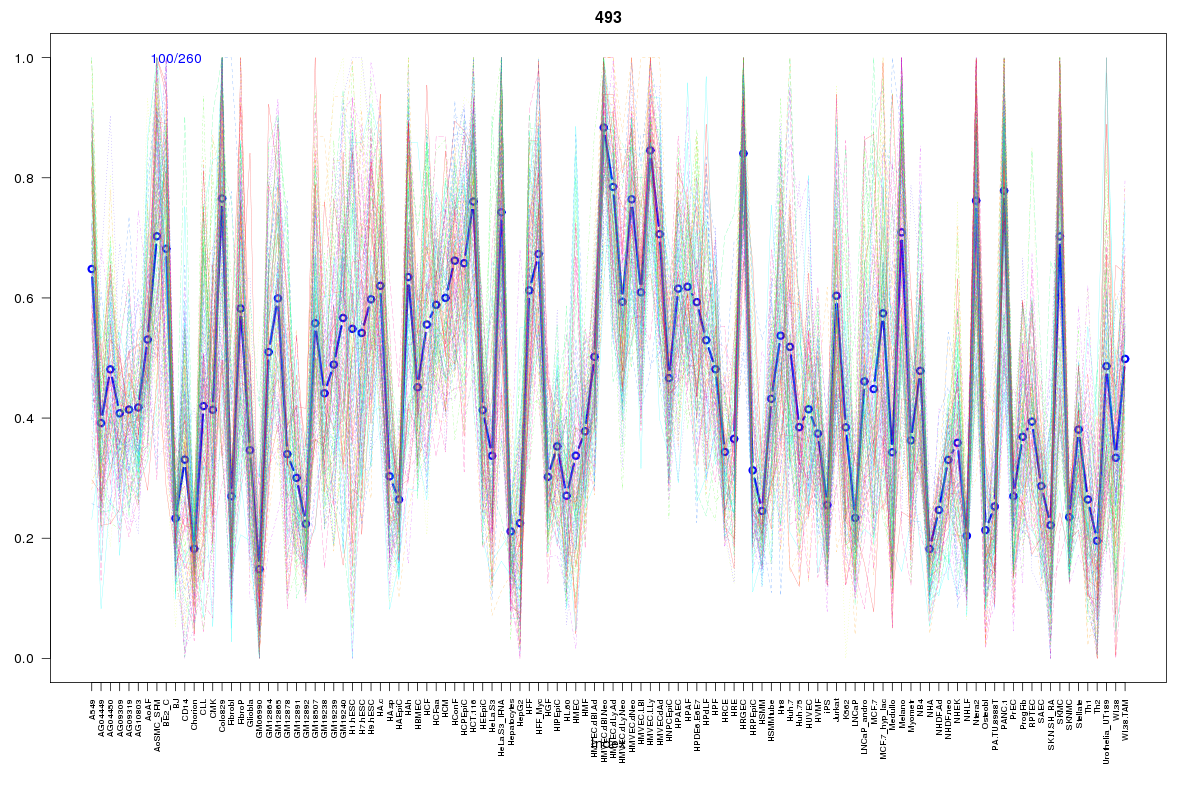
Cluster Hypersensitivity Profile

Genomic Location Trend
These plots show the distribution of the DHS sites surrounding the Transcript Start Site of the nearest gene.
Stats
Number of sites: 260Promoter: 0%
CpG-Island: 0%
Conserved: 78%
Enriched Motifs & Matches
Match Detail: [Jaspar]
|
| ||
|---|---|---|
| Sites: 88/100 | e-val: 0 | ||
| Factor | e-val(match) | DB |
| CTCF | 0.0000000000000018874 | JASPAR |
| INSM1 | 0.00045017 | JASPAR |
| Zfp423 | 0.0011114 | JASPAR |
| TAL1::TCF3 | 0.0071942 | JASPAR |
| T | 0.0091838 | JASPAR |
BED file downloads
Top 10 Example Regions
| Location | Gene Link | Dist. |
|---|---|---|
| chr1: 153395040-153395190 | S100A7A | 47.24 |
| chr2: 160664060-160664210 | AC009961.3 | 53.46 |
| chr2: 160664060-160664210 | CD302 | 53.46 |
| chr7: 95141120-95141270 | PDK4 | 59.41 |
| chrX: 17064740-17064890 | REPS2 | 62.07 |
| chr5: 36265660-36265810 | NADK2-AS1 | 63.04 |
| chr4: 139840400-139840550 | CCRN4L | 64.84 |
| chr1: 227625460-227625610 | CTD-2090I13.1 | 65.88 |
| chr1: 227625460-227625610 | CTD-2090I13.3 | 65.88 |
| chr14: 55904900-55905050 | RPL21P6 | 68.44 |