SOM cluster: 505
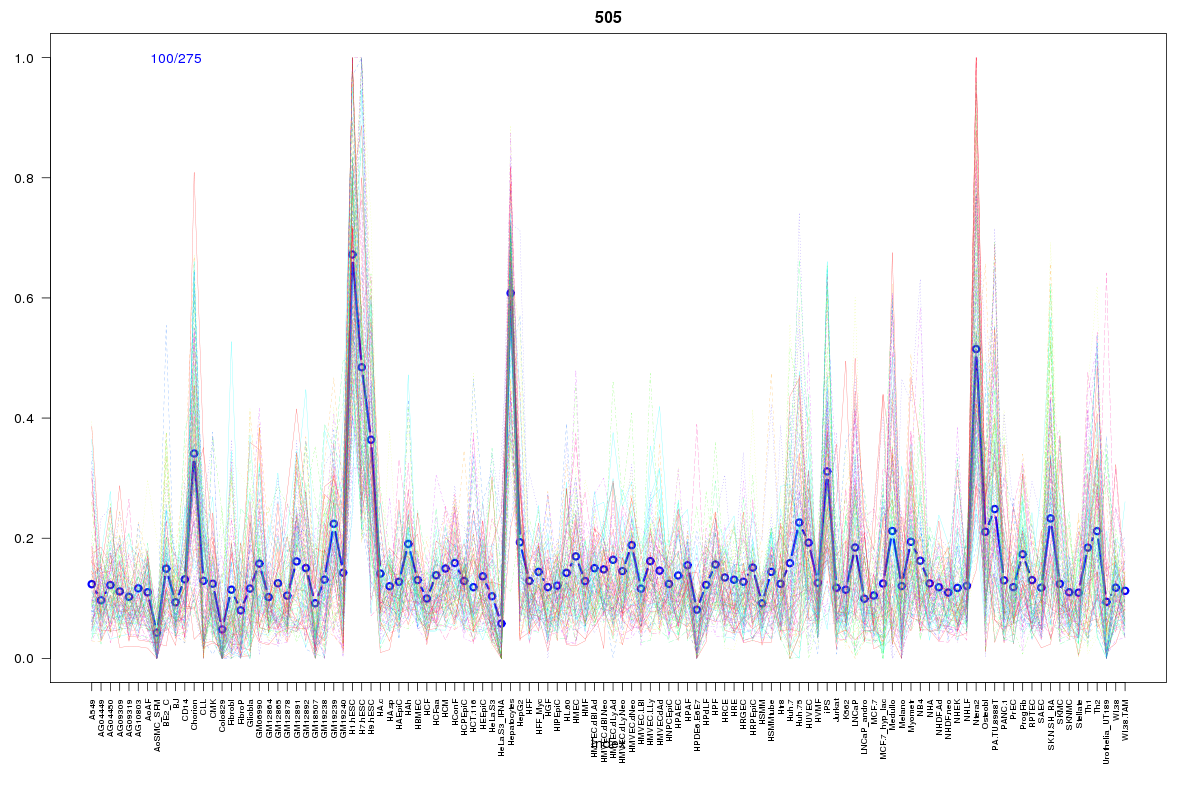
Cluster Hypersensitivity Profile

Genomic Location Trend
These plots show the distribution of the DHS sites surrounding the Transcript Start Site of the nearest gene.
Stats
Number of sites: 275Promoter: 27%
CpG-Island: 59%
Conserved: 54%
Enriched Motifs & Matches
Match Detail: [Jaspar]
|
| ||
|---|---|---|
| Sites: 99/100 | e-val: 1.9e-38 | ||
| Factor | e-val(match) | DB |
| SP1 | 0.00000000003063 | JASPAR |
| Egr1 | 0.000026186 | JASPAR |
| Klf4 | 0.0012313 | JASPAR |
| TFAP2A | 0.0014157 | JASPAR |
| PLAG1 | 0.0014815 | JASPAR |
|
| ||
| Sites: 44/100 | e-val: 1.4 | ||
| Factor | e-val(match) | DB |
| SP1 | 0.000000052535 | JASPAR |
| Pax4 | 0.000027371 | JASPAR |
| Tal1::Gata1 | 0.002327 | JASPAR |
| EWSR1-FLI1 | 0.0026579 | JASPAR |
| MZF1_1-4 | 0.0032362 | JASPAR |
BED file downloads
Top 10 Example Regions
| Location | Gene Link | Dist. |
|---|---|---|
| chr1: 151103540-151103690 | LYSMD1 | 17.16 |
| chr8: 124217665-124217815 | ZHX1 | 29.28 |
| chr8: 21644525-21644675 | GFRA2 | 47.09 |
| chr13: 99403720-99403870 | SLC15A1 | 50.74 |
| chr5: 92785-92935 | PLEKHG4B | 54.53 |
| chr1: 1289365-1289515 | RP4-758J18.2 | 56.25 |
| chr1: 1289365-1289515 | CPSF3L | 56.25 |
| chr1: 1289365-1289515 | AURKAIP1 | 56.25 |
| chr1: 1289365-1289515 | ATAD3C | 56.25 |
| chr1: 48462045-48462195 | RP4-683M8.2 | 57.9 |