SOM cluster: 509
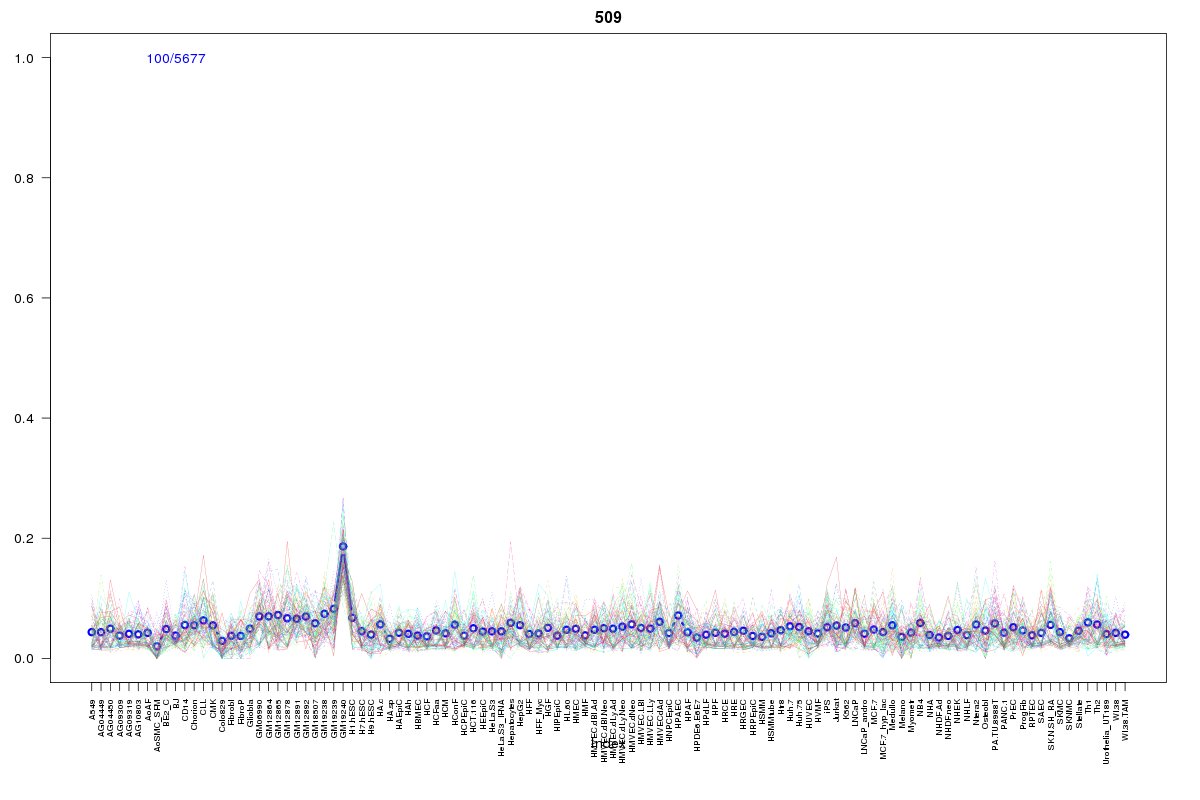
Cluster Hypersensitivity Profile

Genomic Location Trend
These plots show the distribution of the DHS sites surrounding the Transcript Start Site of the nearest gene.
Stats
Number of sites: 5677Promoter: 1%
CpG-Island: 0%
Conserved: 21%
Enriched Motifs & Matches
Match Detail: [Jaspar]
|
| ||
|---|---|---|
| Sites: 56/100 | e-val: 3.4e-18 | ||
| Factor | e-val(match) | DB |
| Pax4 | 0.0000059284 | JASPAR |
| SP1 | 0.000016692 | JASPAR |
| EWSR1-FLI1 | 0.000064751 | JASPAR |
| RREB1 | 0.00052698 | JASPAR |
| Klf4 | 0.004512 | JASPAR |
|
| ||
| Sites: 25/100 | e-val: 0.000051 | ||
| Factor | e-val(match) | DB |
| Klf4 | 0.00034461 | JASPAR |
| SP1 | 0.0004261 | JASPAR |
| RXR::RAR_DR5 | 0.0074608 | JASPAR |
| Zfx | 0.0095166 | JASPAR |
| PPARG::RXRA | 0.011896 | JASPAR |
|
| ||
| Sites: 31/100 | e-val: 0.047 | ||
| Factor | e-val(match) | DB |
| Tcfcp2l1 | 0.0021709 | JASPAR |
| SP1 | 0.0024784 | JASPAR |
| Pax4 | 0.0043343 | JASPAR |
| Stat3 | 0.0092887 | JASPAR |
| INSM1 | 0.014071 | JASPAR |
BED file downloads
Top 10 Example Regions
| Location | Gene Link | Dist. |
|---|---|---|
| chr1: 150185305-150185455 | snoU13 | 18.8 |
| chr9: 36845065-36845215 | PAX5 | 29.79 |
| chr2: 135217245-135217395 | TMEM163 | 41.34 |
| chr16: 89962345-89962495 | AC092143.1 | 46.32 |
| chr16: 89962345-89962495 | MC1R | 46.32 |
| chr22: 40032785-40032935 | CACNA1I | 46.39 |
| chr9: 127570165-127570315 | WDR38 | 46.44 |
| chr2: 71300085-71300235 | NAGK | 46.63 |
| chr3: 12584005-12584155 | RNA5SP123 | 49.01 |
| chr3: 195868265-195868415 | TFRC | 49.14 |