SOM cluster: 514
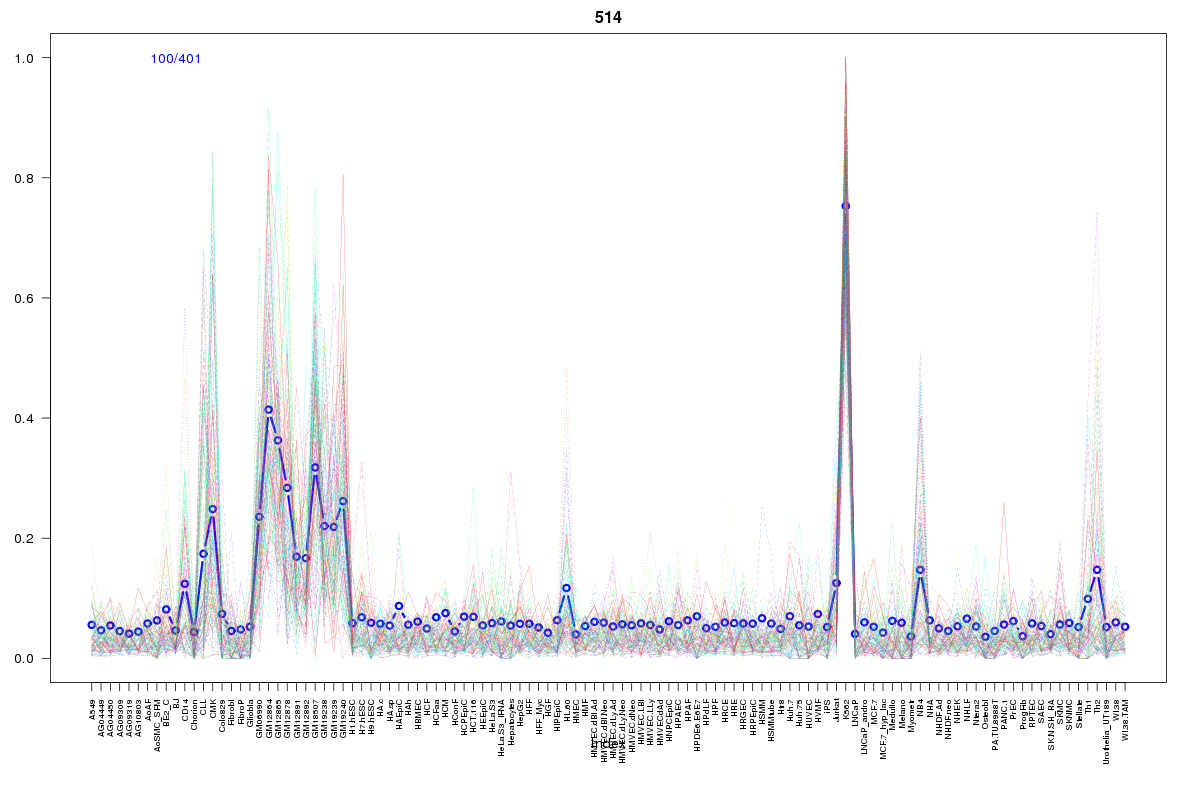
Cluster Hypersensitivity Profile

Genomic Location Trend
These plots show the distribution of the DHS sites surrounding the Transcript Start Site of the nearest gene.
Stats
Number of sites: 401Promoter: 4%
CpG-Island: 0%
Conserved: 26%
Enriched Motifs & Matches
No motifs found.BED file downloads
Top 10 Example Regions
| Location | Gene Link | Dist. |
|---|---|---|
| chr1: 145502060-145502210 | ITGA10 | 20.81 |
| chr1: 145502060-145502210 | PIAS3 | 20.81 |
| chr1: 145502060-145502210 | RBM8A | 20.81 |
| chr12: 9893060-9893210 | CLECL1 | 27.48 |
| chr1: 93498620-93498770 | MTF2 | 31.03 |
| chr19: 35865980-35866130 | CD22 | 47.56 |
| chr19: 50864660-50864810 | POLD1 | 48.57 |
| chr22: 21942120-21942270 | PPIL2 | 50.93 |
| chr7: 44253625-44253775 | CAMK2B | 51.97 |
| chr1: 193039620-193039770 | TROVE2 | 57.08 |