SOM cluster: 523
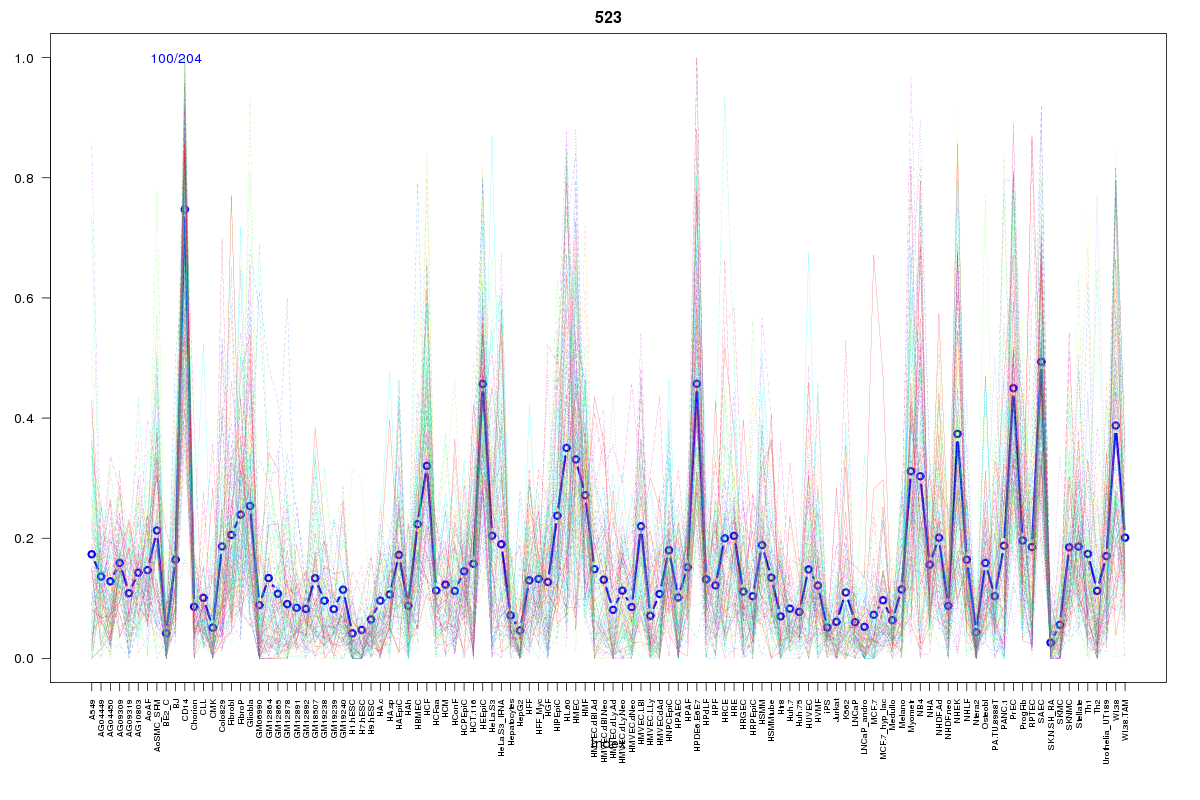
Cluster Hypersensitivity Profile

Genomic Location Trend
These plots show the distribution of the DHS sites surrounding the Transcript Start Site of the nearest gene.
Stats
Number of sites: 204Promoter: 2%
CpG-Island: 0%
Conserved: 18%
Enriched Motifs & Matches
Match Detail: [Jaspar]
|
| ||
|---|---|---|
| Sites: 32/100 | e-val: 0.000000000000017 | ||
| Factor | e-val(match) | DB |
| AP1 | 0.000000002795 | JASPAR |
| NFE2L2 | 0.00000014162 | JASPAR |
| NFE2L1::MafG | 0.00030688 | JASPAR |
| Lhx3 | 0.0038886 | JASPAR |
| Foxa2 | 0.008647 | JASPAR |
BED file downloads
Top 10 Example Regions
| Location | Gene Link | Dist. |
|---|---|---|
| chr17: 518500-518650 | VPS53 | 35.25 |
| chr1: 209780685-209780835 | RP1-272L16.1 | 44.88 |
| chr1: 209780685-209780835 | G0S2 | 44.88 |
| chr1: 209780685-209780835 | LAMB3 | 44.88 |
| chr3: 53148840-53148990 | PRKCD | 47.38 |
| chr11: 1610580-1610730 | KRTAP5-2 | 47.84 |
| chr4: 40488820-40488970 | RBM47 | 51.05 |
| chr4: 154573260-154573410 | TLR2 | 51.27 |
| chr4: 166125700-166125850 | KLHL2 | 51.43 |
| chr8: 67696560-67696710 | SGK3 | 58.51 |