SOM cluster: 531
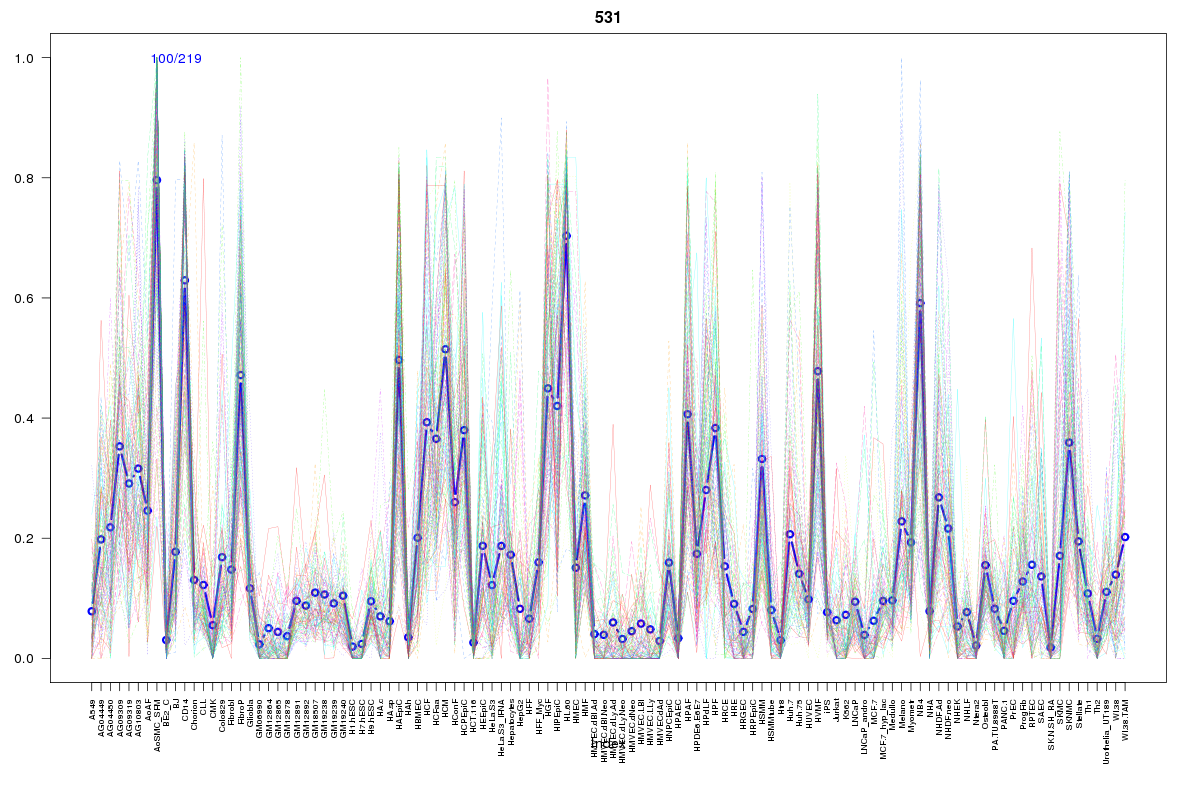
Cluster Hypersensitivity Profile

Genomic Location Trend
These plots show the distribution of the DHS sites surrounding the Transcript Start Site of the nearest gene.
Stats
Number of sites: 219Promoter: 2%
CpG-Island: 0%
Conserved: 43%
Enriched Motifs & Matches
Match Detail: [Jaspar]
|
| ||
|---|---|---|
| Sites: 63/100 | e-val: 3.1e-38 | ||
| Factor | e-val(match) | DB |
| CEBPA | 0.000000069552 | JASPAR |
| HLF | 0.00027692 | JASPAR |
| NFIL3 | 0.0021141 | JASPAR |
| Ddit3::Cebpa | 0.0033992 | JASPAR |
| Pou5f1 | 0.0047291 | JASPAR |
BED file downloads
Top 10 Example Regions
| Location | Gene Link | Dist. |
|---|---|---|
| chr17: 76409240-76409390 | DNAH17 | 44.2 |
| chr17: 76409240-76409390 | SOCS3 | 44.2 |
| chr1: 221055905-221056055 | HLX | 47.51 |
| chr11: 129921060-129921210 | PRDM10 | 49.83 |
| chr11: 110280000-110280150 | RP11-347E10.1 | 50.77 |
| chr22: 22416040-22416190 | TOP3B | 53.63 |
| chr22: 22416040-22416190 | IGLVV-66 | 53.63 |
| chr3: 151271820-151271970 | IGSF10 | 57.76 |
| chr10: 30919620-30919770 | RP11-14C22.6 | 62.11 |
| chr11: 64653620-64653770 | MEN1 | 64.63 |