SOM cluster: 532
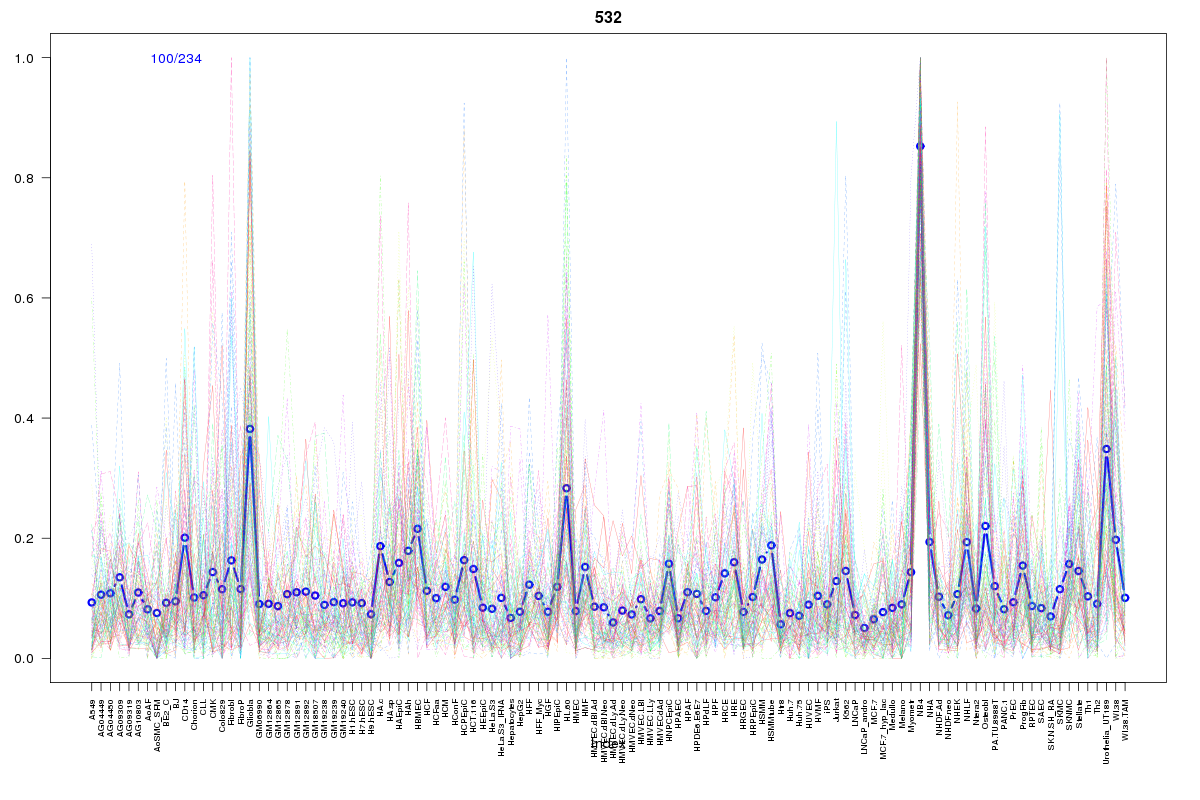
Cluster Hypersensitivity Profile

Genomic Location Trend
These plots show the distribution of the DHS sites surrounding the Transcript Start Site of the nearest gene.
Stats
Number of sites: 234Promoter: 6%
CpG-Island: 0%
Conserved: 25%
Enriched Motifs & Matches
Match Detail: [Jaspar]
|
| ||
|---|---|---|
| Sites: 23/100 | e-val: 0.00000086 | ||
| Factor | e-val(match) | DB |
| AP1 | 0.000000013364 | JASPAR |
| NFE2L2 | 0.00000051336 | JASPAR |
| PPARG | 0.0033626 | JASPAR |
| NR4A2 | 0.0035304 | JASPAR |
| Pax2 | 0.011843 | JASPAR |
BED file downloads
Top 10 Example Regions
| Location | Gene Link | Dist. |
|---|---|---|
| chr17: 76325940-76326090 | DNAH17 | 43.33 |
| chr3: 73143520-73143670 | PPP4R2 | 56.92 |
| chr6: 36737205-36737355 | CDKN1A | 58.34 |
| chr6: 36737205-36737355 | PPIL1 | 58.34 |
| chr17: 44872825-44872975 | NSF | 59.71 |
| chr17: 44872825-44872975 | WNT3 | 59.71 |
| chr9: 116326885-116327035 | RP11-168K11.2 | 60.7 |
| chr11: 63749700-63749850 | RP11-21A7A.4 | 62.28 |
| chr20: 61347540-61347690 | SLCO4A1 | 63.58 |
| chr20: 61347540-61347690 | LINC00686 | 63.58 |