SOM cluster: 537
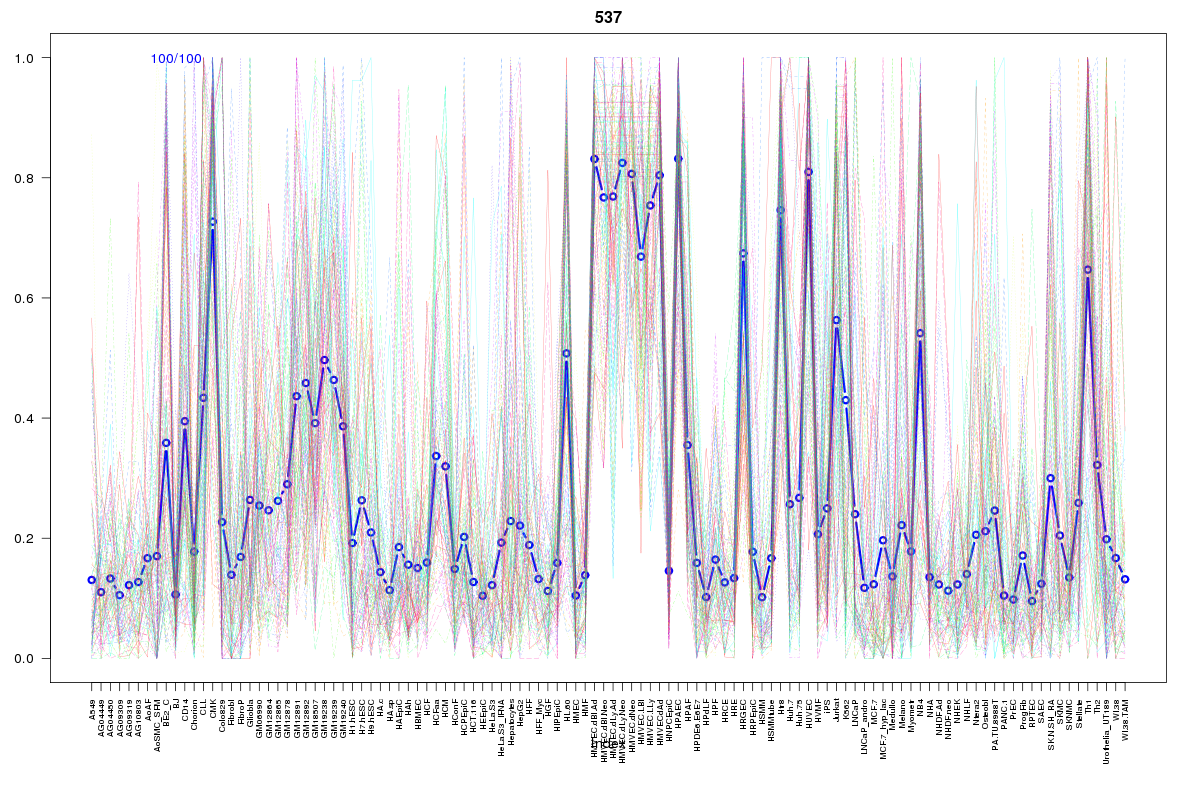
Cluster Hypersensitivity Profile

Genomic Location Trend
These plots show the distribution of the DHS sites surrounding the Transcript Start Site of the nearest gene.
Stats
Number of sites: 100Promoter: 7%
CpG-Island: 9%
Conserved: 59%
Enriched Motifs & Matches
Match Detail: [Jaspar]
|
| ||
|---|---|---|
| Sites: 70/100 | e-val: 3.50325e-43 | ||
| Factor | e-val(match) | DB |
| FEV | 0.0000030394 | JASPAR |
| SPI1 | 0.000015797 | JASPAR |
| Stat3 | 0.00010354 | JASPAR |
| SPIB | 0.00015547 | JASPAR |
| ELK4 | 0.00017837 | JASPAR |
BED file downloads
Top 10 Example Regions
| Location | Gene Link | Dist. |
|---|---|---|
| chr1: 47697480-47697630 | TAL1 | 35.88 |
| chr1: 47697480-47697630 | LINC00853 | 35.88 |
| chr1: 47697480-47697630 | RP1-18D14.7 | 35.88 |
| chr7: 37394520-37394670 | ELMO1 | 52.78 |
| chr12: 7830120-7830270 | NANOGNB | 53.35 |
| chr20: 50157660-50157810 | NFATC2 | 57.97 |
| chr1: 154469560-154469710 | SHE | 58.41 |
| chr22: 19879780-19879930 | ARVCF | 60.98 |
| chr22: 19879780-19879930 | TXNRD2 | 60.98 |
| chr22: 19879780-19879930 | C22orf29 | 60.98 |