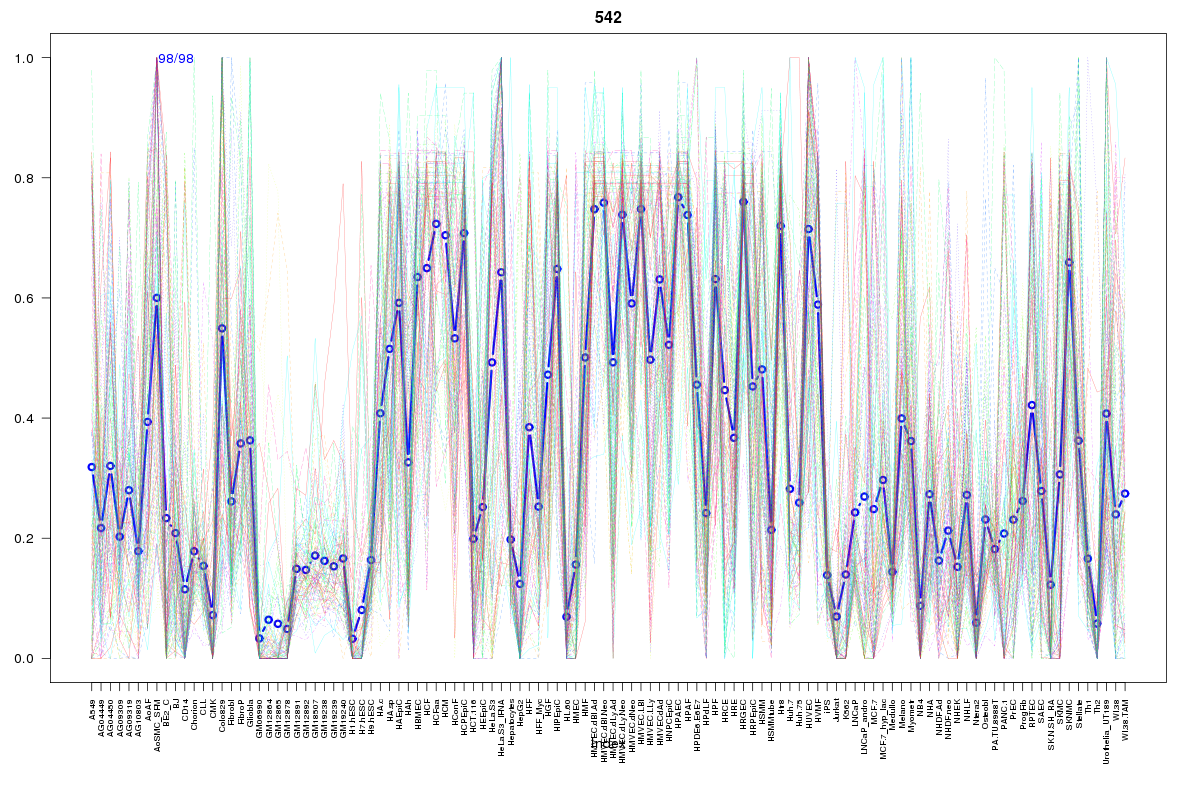
SOM cluster: 542
Cluster Hypersensitivity Profile

Genomic Location Trend
These plots show the distribution of the DHS sites surrounding the Transcript Start Site of the nearest gene.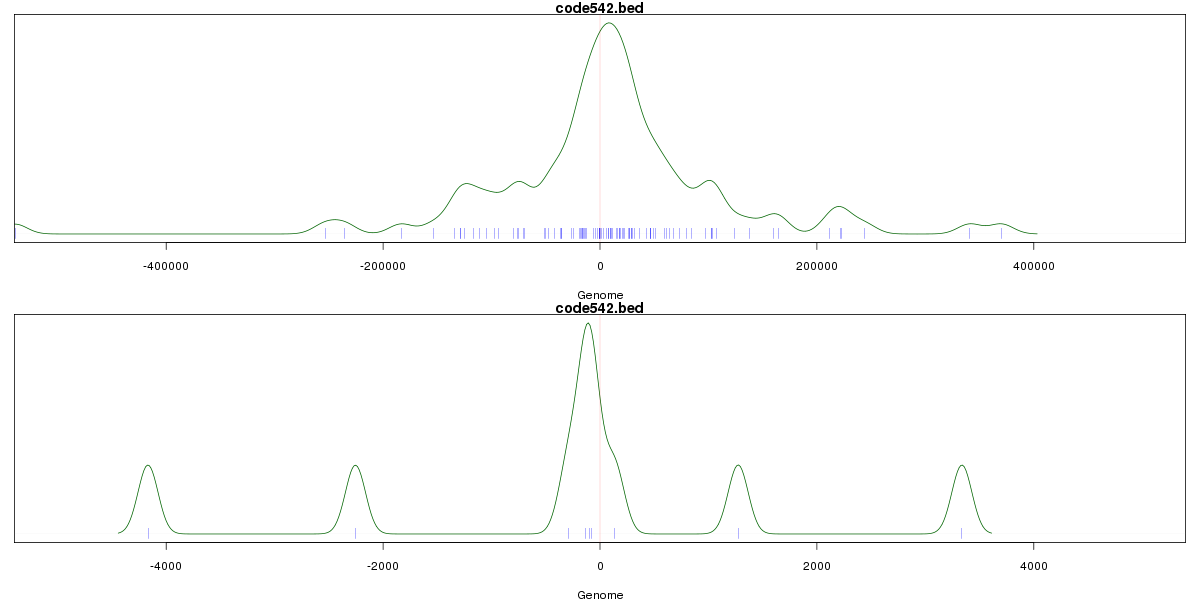
Stats
Number of sites: 98Promoter: 4%
CpG-Island: 0%
Conserved: 52%
Enriched Motifs & Matches
Match Detail: [Jaspar]
|
| ||
|---|---|---|
| Sites: 25/98 | e-val: 0.00000000036 | ||
| Factor | e-val(match) | DB |
| Foxd3 | 0.000000042317 | JASPAR |
| FOXI1 | 0.000060868 | JASPAR |
| Foxq1 | 0.00016097 | JASPAR |
| FOXA1 | 0.00078408 | JASPAR |
| FOXF2 | 0.001591 | JASPAR |
|
| ||
| Sites: 21/98 | e-val: 0.00000000027 | ||
| Factor | e-val(match) | DB |
| TLX1::NFIC | 0.00000000099212 | JASPAR |
| NFIC | 0.0028105 | JASPAR |
| REL | 0.0060407 | JASPAR |
| znf143 | 0.0086256 | JASPAR |
| E2F1 | 0.015058 | JASPAR |
BED file downloads
Top 10 Example Regions
| Location | Gene Link | Dist. |
|---|---|---|
| chr10: 4719980-4720130 | LINC00704 | 17.29 |
| chr7: 106820940-106821090 | HBP1 | 38.79 |
| chr3: 147876100-147876250 | HNRNPA1P20 | 52.68 |
| chr3: 134164620-134164770 | AMOTL2 | 58.52 |
| chr3: 149113600-149113750 | RP11-2G17.1 | 60.09 |
| chr3: 149113600-149113750 | TM4SF18 | 60.09 |
| chr3: 149113600-149113750 | TM4SF1 | 60.09 |
| chr1: 234679865-234680015 | RP4-781K5.2 | 70.61 |
| chr7: 95179540-95179690 | PDK4 | 70.97 |
| chr7: 95179540-95179690 | AC002451.3 | 70.97 |