SOM cluster: 545
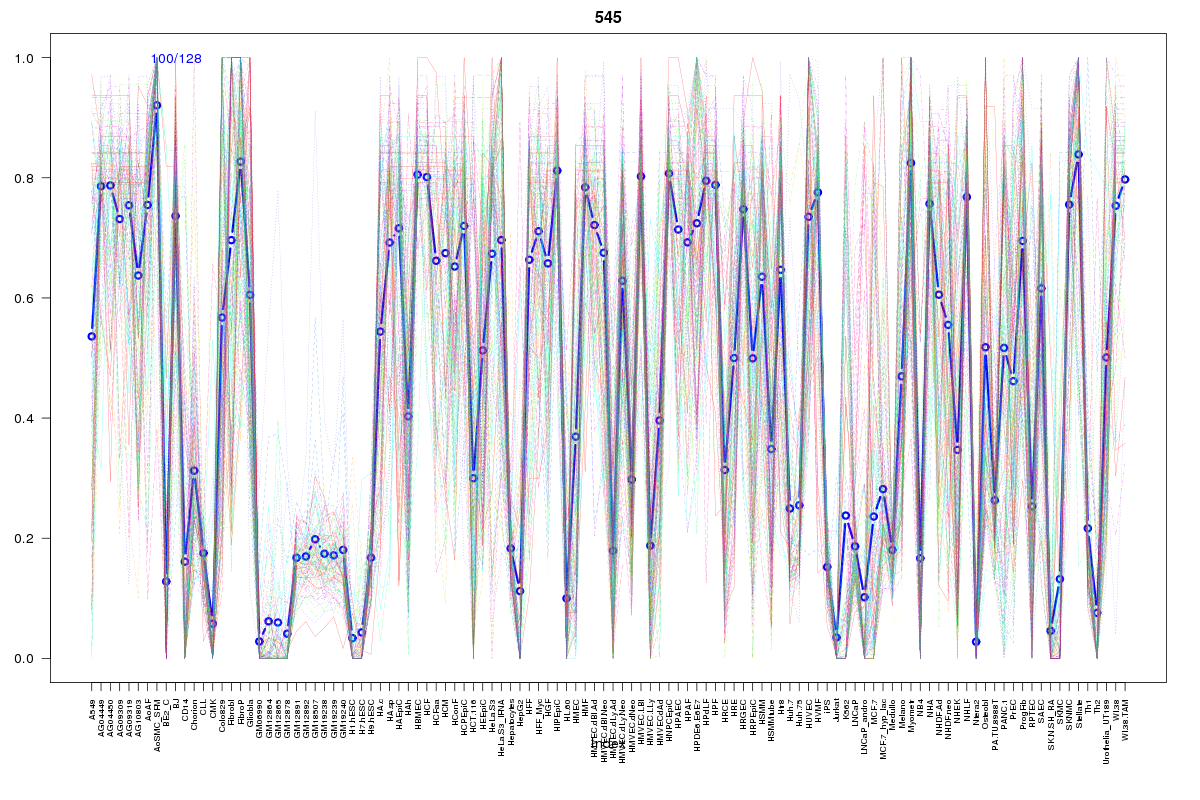
Cluster Hypersensitivity Profile

Genomic Location Trend
These plots show the distribution of the DHS sites surrounding the Transcript Start Site of the nearest gene.
Stats
Number of sites: 128Promoter: 6%
CpG-Island: 1%
Conserved: 47%
Enriched Motifs & Matches
Match Detail: [Jaspar]
|
| ||
|---|---|---|
| Sites: 63/100 | e-val: 1e-33 | ||
| Factor | e-val(match) | DB |
| AP1 | 0.00000000078682 | JASPAR |
| NFE2L2 | 0.0000010075 | JASPAR |
| NFE2L1::MafG | 0.013911 | JASPAR |
| PPARG | 0.043511 | JASPAR |
| Foxa2 | 0.065762 | JASPAR |
BED file downloads
Top 10 Example Regions
| Location | Gene Link | Dist. |
|---|---|---|
| chr9: 33320980-33321130 | BAG1 | 51.87 |
| chr2: 128528680-128528830 | POLR2D | 52.02 |
| chr2: 128528680-128528830 | SFT2D3 | 52.02 |
| chr2: 128528680-128528830 | AC006011.4 | 52.02 |
| chr2: 128528680-128528830 | WDR33 | 52.02 |
| chr1: 117635705-117635855 | RP11-27K13.3 | 52.88 |
| chr1: 117635705-117635855 | TTF2 | 52.88 |
| chr1: 117635705-117635855 | CD101 | 52.88 |
| chr3: 11279900-11280050 | ATG7 | 57.6 |
| chr3: 11279900-11280050 | HRH1 | 57.6 |