SOM cluster: 555
Cluster Hypersensitivity Profile

Genomic Location Trend
These plots show the distribution of the DHS sites surrounding the Transcript Start Site of the nearest gene.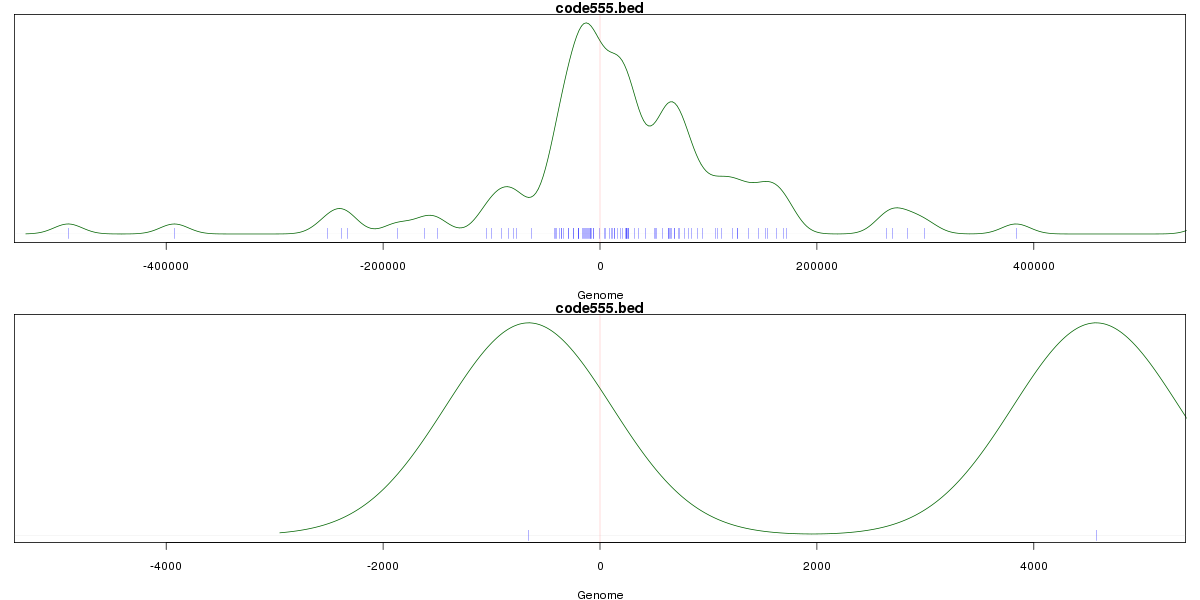
Stats
Number of sites: 387Promoter: 1%
CpG-Island: 0%
Conserved: 57%
Enriched Motifs & Matches
Match Detail: [Jaspar]
|
| ||
|---|---|---|
| Sites: 68/100 | e-val: 0 | ||
| Factor | e-val(match) | DB |
| CTCF | 0.00000000000071421 | JASPAR |
| INSM1 | 0.00019537 | JASPAR |
| Zfp423 | 0.0021708 | JASPAR |
| T | 0.0066481 | JASPAR |
| MYC::MAX | 0.0094499 | JASPAR |
BED file downloads
Top 10 Example Regions
| Location | Gene Link | Dist. |
|---|---|---|
| chr8: 104311485-104311635 | BAALC | 32.05 |
| chrX: 130767600-130767750 | OR2AF1P | 36.92 |
| chr1: 75731500-75731650 | SLC44A5 | 40.39 |
| chr1: 75731500-75731650 | RNU6-622P | 40.39 |
| chr5: 71565040-71565190 | MRPS27 | 57.85 |
| chr12: 10078480-10078630 | CLEC1B | 58.07 |
| chr12: 10366560-10366710 | CLEC7A | 60.04 |
| chr1: 214801620-214801770 | CENPF | 63.44 |
| chrX: 102942680-102942830 | TMEM31 | 63.74 |
| chrX: 102942680-102942830 | MORF4L2-AS1 | 63.74 |