SOM cluster: 57
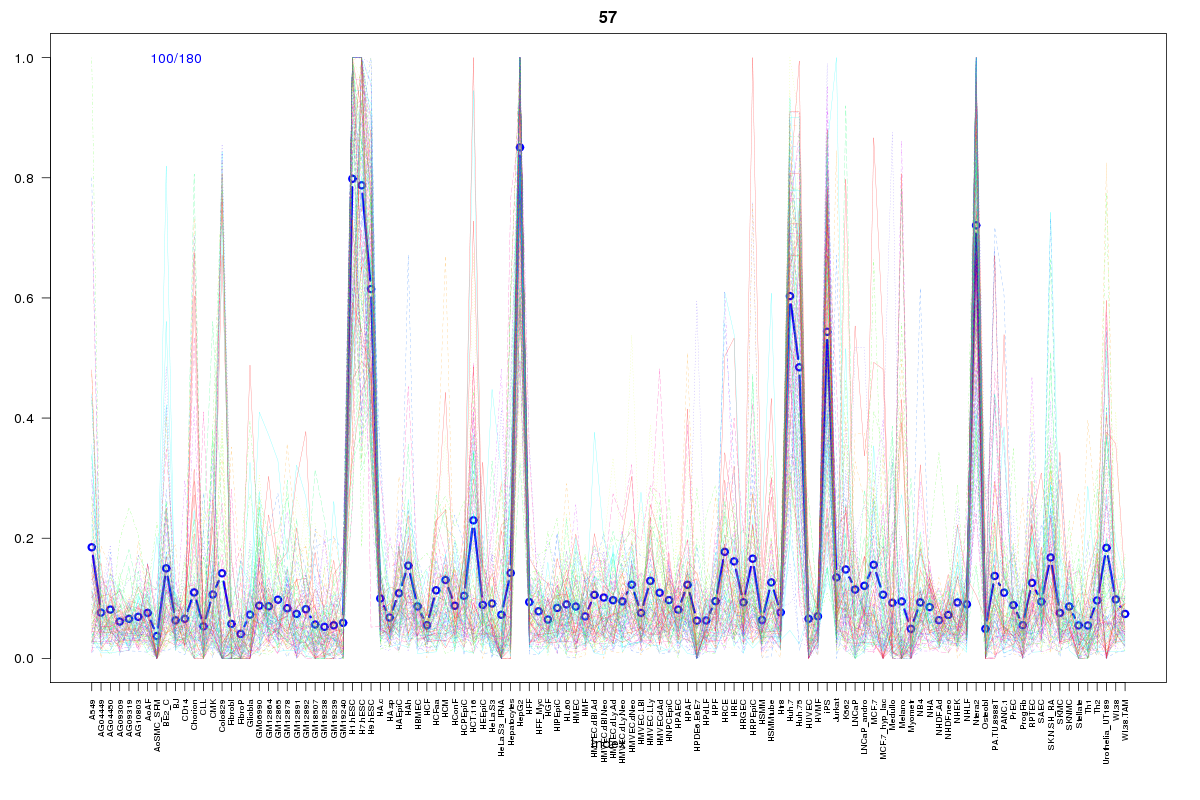
Cluster Hypersensitivity Profile

Genomic Location Trend
These plots show the distribution of the DHS sites surrounding the Transcript Start Site of the nearest gene.
Stats
Number of sites: 180Promoter: 13%
CpG-Island: 11%
Conserved: 62%
Enriched Motifs & Matches
Match Detail: [Jaspar]
|
| ||
|---|---|---|
| Sites: 60/100 | e-val: 1.26117e-44 | ||
| Factor | e-val(match) | DB |
| SP1 | 0.0000000000005882 | JASPAR |
| Klf4 | 0.0000044207 | JASPAR |
| PPARG::RXRA | 0.00059563 | JASPAR |
| Pax4 | 0.00072667 | JASPAR |
| Tal1::Gata1 | 0.0010828 | JASPAR |
|
| ||
| Sites: 40/100 | e-val: 0.000000000015 | ||
| Factor | e-val(match) | DB |
| SP1 | 0.0000000011842 | JASPAR |
| Pax4 | 0.0000038978 | JASPAR |
| RREB1 | 0.000022821 | JASPAR |
| Klf4 | 0.0017208 | JASPAR |
| TFAP2A | 0.0035985 | JASPAR |
BED file downloads
Top 10 Example Regions
| Location | Gene Link | Dist. |
|---|---|---|
| chr1: 204047625-204047775 | SOX13 | 41.46 |
| chr1: 204047625-204047775 | ETNK2 | 41.46 |
| chr8: 38411240-38411390 | RP11-675F6.4 | 51.78 |
| chr8: 38411240-38411390 | RP11-675F6.3 | 51.78 |
| chr19: 39794085-39794235 | GMFG | 57.66 |
| chr11: 67895565-67895715 | CHKA | 58.2 |
| chr11: 116708640-116708790 | APOA1 | 62.8 |
| chr11: 116708640-116708790 | APOA5 | 62.8 |
| chr11: 116708640-116708790 | APOC3 | 62.8 |
| chr2: 220441640-220441790 | OBSL1 | 63.71 |