SOM cluster: 587
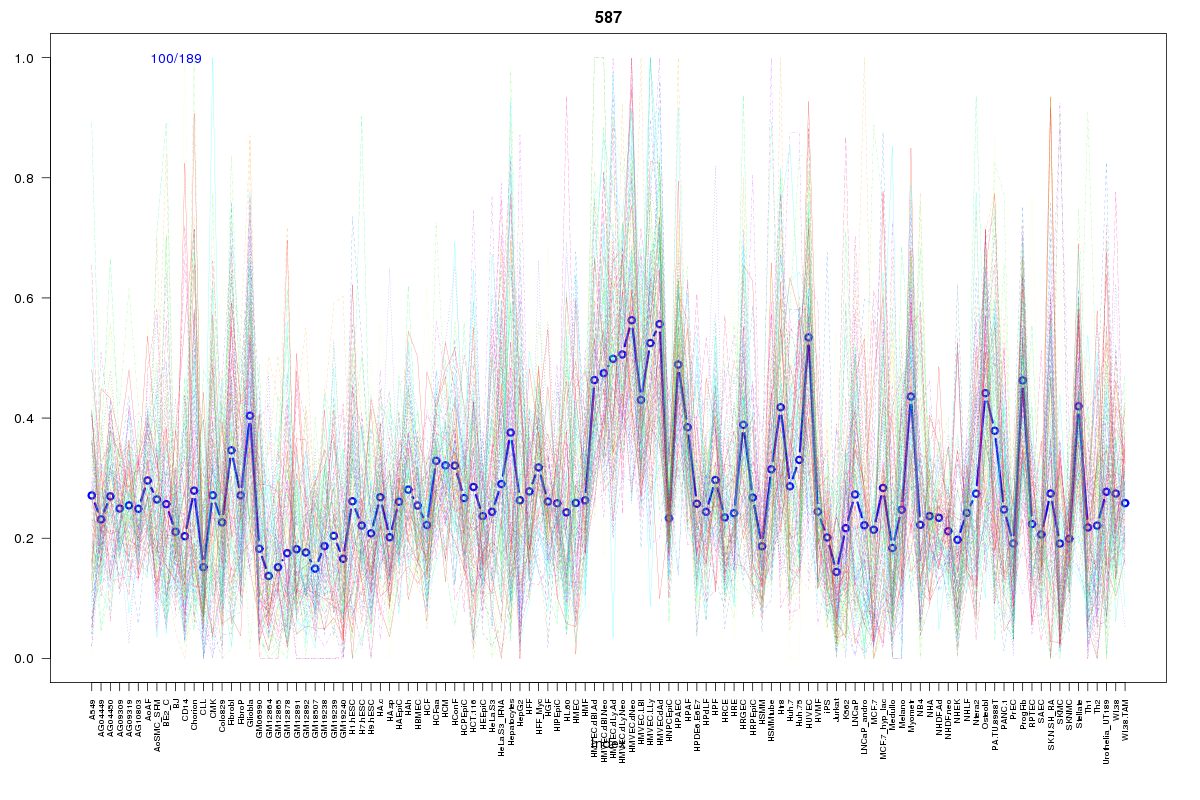
Cluster Hypersensitivity Profile

Genomic Location Trend
These plots show the distribution of the DHS sites surrounding the Transcript Start Site of the nearest gene.
Stats
Number of sites: 189Promoter: 29%
CpG-Island: 44%
Conserved: 63%
Enriched Motifs & Matches
Match Detail: [Jaspar]
|
| ||
|---|---|---|
| Sites: 55/100 | e-val: 0.00000011 | ||
| Factor | e-val(match) | DB |
| SP1 | 0.000000035664 | JASPAR |
| TFAP2A | 0.00048184 | JASPAR |
| RREB1 | 0.0018138 | JASPAR |
| Egr1 | 0.0031095 | JASPAR |
| Klf4 | 0.0065073 | JASPAR |
BED file downloads
Top 10 Example Regions
| Location | Gene Link | Dist. |
|---|---|---|
| chr1: 61522680-61522830 | NFIA | 30.12 |
| chr14: 24803205-24803355 | RP11-934B9.3 | 44.97 |
| chr14: 24803205-24803355 | ADCY4 | 44.97 |
| chr14: 24803205-24803355 | NOP9 | 44.97 |
| chr4: 8202485-8202635 | SH3TC1 | 48.67 |
| chr14: 53417220-53417370 | RP11-368P15.3 | 55.62 |
| chr15: 75930980-75931130 | DNM1P35 | 56.01 |
| chr12: 106696965-106697115 | POLR3B | 59.29 |
| chr12: 106696965-106697115 | TCP11L2 | 59.29 |
| chr17: 15164580-15164730 | PMP22 | 60.62 |