SOM cluster: 588
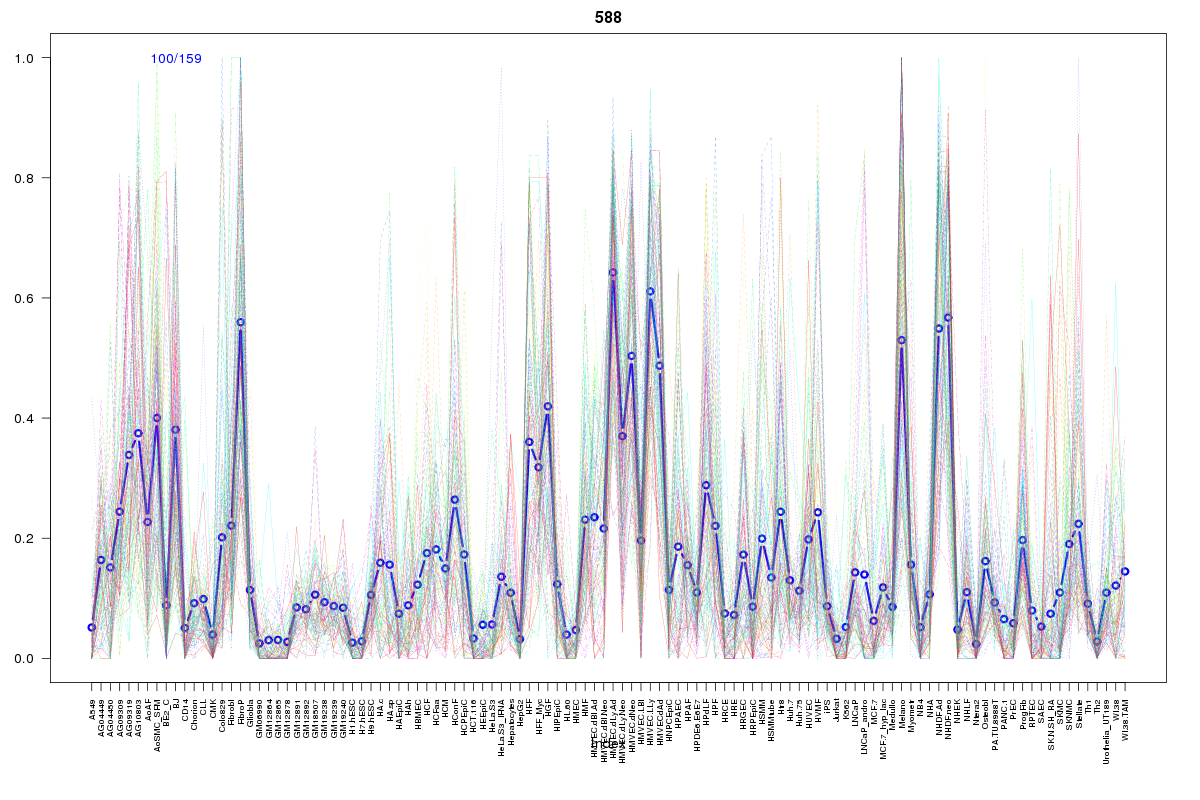
Cluster Hypersensitivity Profile

Genomic Location Trend
These plots show the distribution of the DHS sites surrounding the Transcript Start Site of the nearest gene.
Stats
Number of sites: 159Promoter: 1%
CpG-Island: 0%
Conserved: 66%
Enriched Motifs & Matches
Match Detail: [Jaspar]
|
| ||
|---|---|---|
| Sites: 37/100 | e-val: 0.0000000000015 | ||
| Factor | e-val(match) | DB |
| Foxd3 | 0.000028498 | JASPAR |
| Pax4 | 0.000086481 | JASPAR |
| Foxq1 | 0.0054225 | JASPAR |
| FOXI1 | 0.0080338 | JASPAR |
| SRY | 0.033468 | JASPAR |
|
| ||
| Sites: 25/100 | e-val: 0.0058 | ||
| Factor | e-val(match) | DB |
| TAL1::TCF3 | 0.00000026683 | JASPAR |
| Myf | 0.00018524 | JASPAR |
| NHLH1 | 0.0014388 | JASPAR |
| Spz1 | 0.0022347 | JASPAR |
| FOXO3 | 0.0040734 | JASPAR |
BED file downloads
Top 10 Example Regions
| Location | Gene Link | Dist. |
|---|---|---|
| chrX: 15769460-15769610 | TMEM27 | 48.37 |
| chrX: 15769460-15769610 | CA5B | 48.37 |
| chr11: 114179440-114179590 | NNMT | 52.51 |
| chr8: 39939220-39939370 | C8orf4 | 52.7 |
| chr6: 114245540-114245690 | RP11-544L8__B.4 | 59.69 |
| chr6: 114245540-114245690 | HDAC2 | 59.69 |
| chr6: 114245540-114245690 | MARCKS | 59.69 |
| chr8: 56829120-56829270 | TGS1 | 62.51 |
| chr1: 211784520-211784670 | NEK2 | 64.95 |
| chr1: 211784520-211784670 | RP11-122M14.1 | 64.95 |