SOM cluster: 594
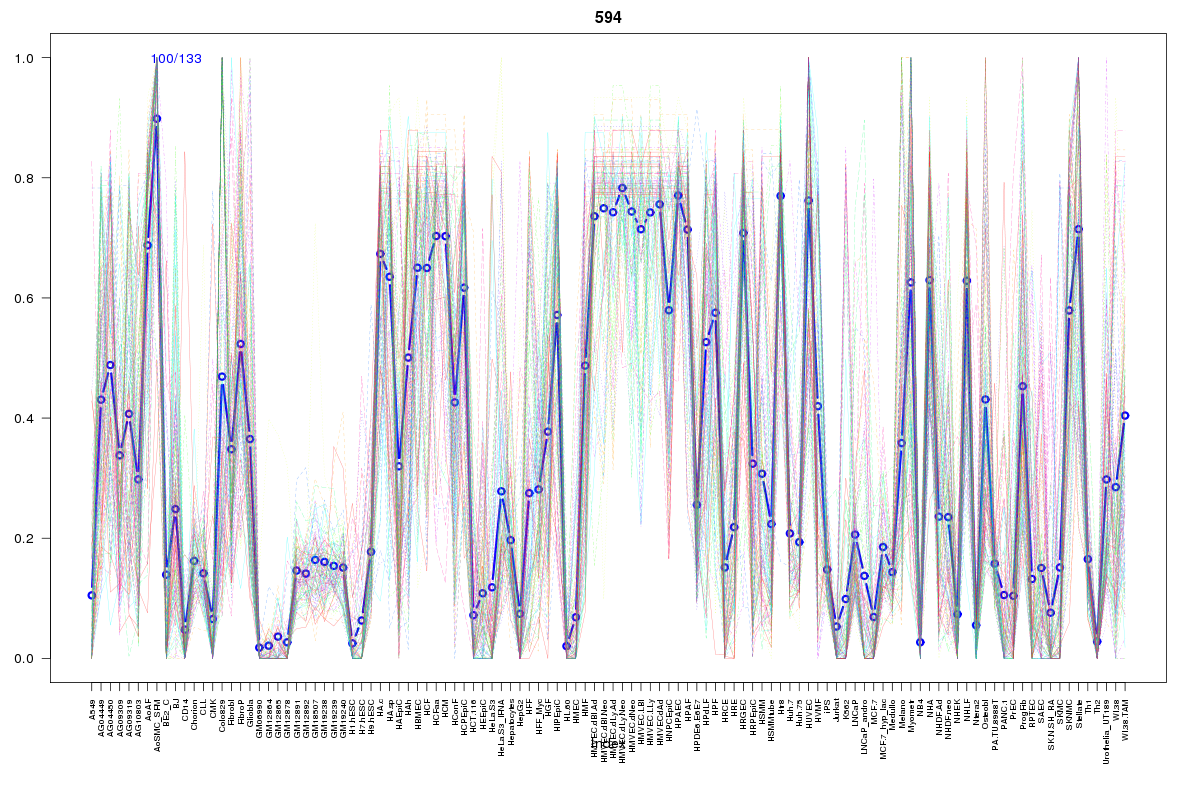
Cluster Hypersensitivity Profile

Genomic Location Trend
These plots show the distribution of the DHS sites surrounding the Transcript Start Site of the nearest gene.
Stats
Number of sites: 133Promoter: 1%
CpG-Island: 0%
Conserved: 70%
Enriched Motifs & Matches
Match Detail: [Jaspar]
|
| ||
|---|---|---|
| Sites: 40/100 | e-val: 0.00000000000011 | ||
| Factor | e-val(match) | DB |
| Foxa2 | 0.000000076223 | JASPAR |
| Foxd3 | 0.0000010501 | JASPAR |
| FOXI1 | 0.000011605 | JASPAR |
| Foxq1 | 0.00002433 | JASPAR |
| FOXA1 | 0.000042874 | JASPAR |
|
| ||
| Sites: 44/100 | e-val: 0.00000000000033 | ||
| Factor | e-val(match) | DB |
| NFATC2 | 0.000044808 | JASPAR |
| AP1 | 0.0011061 | JASPAR |
| RELA | 0.0039182 | JASPAR |
| NFE2L2 | 0.0054938 | JASPAR |
| Foxa2 | 0.005976 | JASPAR |
BED file downloads
Top 10 Example Regions
| Location | Gene Link | Dist. |
|---|---|---|
| chr3: 156025660-156025810 | KCNAB1 | 45.61 |
| chr13: 100752680-100752830 | NDUFA12P1 | 45.73 |
| chr9: 116692100-116692250 | ZNF618 | 48.56 |
| chr7: 115994280-115994430 | CAV2 | 50.9 |
| chr2: 64291740-64291890 | AC074289.1 | 53.78 |
| chr1: 55595120-55595270 | USP24 | 58.56 |
| chr6: 7992920-7993070 | BLOC1S5-TXNDC5 | 61.13 |
| chr6: 7992920-7993070 | TXNDC5 | 61.13 |
| chr3: 146026100-146026250 | PLSCR4 | 64.56 |
| chr17: 2075740-2075890 | SMG6 | 66.98 |