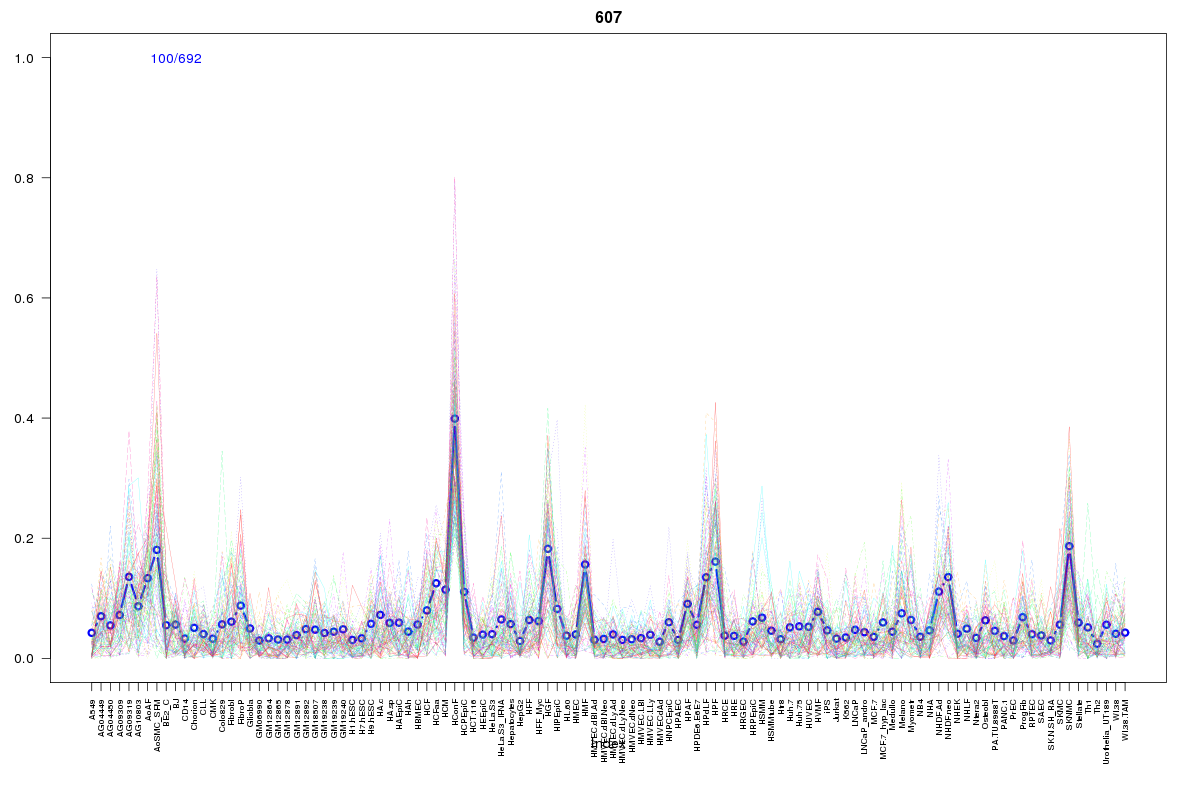
SOM cluster: 607
Cluster Hypersensitivity Profile

Genomic Location Trend
These plots show the distribution of the DHS sites surrounding the Transcript Start Site of the nearest gene.
Stats
Number of sites: 692Promoter: 1%
CpG-Island: 0%
Conserved: 32%
Enriched Motifs & Matches
Match Detail: [Jaspar]
|
| ||
|---|---|---|
| Sites: 30/100 | e-val: 0.0000001 | ||
| Factor | e-val(match) | DB |
| Lhx3 | 0.0034928 | JASPAR |
| Prrx2 | 0.0068499 | JASPAR |
| Evi1 | 0.030839 | JASPAR |
| FEV | 0.032843 | JASPAR |
| HNF1A | 0.043392 | JASPAR |
|
| ||
| Sites: 17/100 | e-val: 2.5 | ||
| Factor | e-val(match) | DB |
| ARID3A | 0.0004392 | JASPAR |
| Lhx3 | 0.00087151 | JASPAR |
| FOXA1 | 0.0026697 | JASPAR |
| Prrx2 | 0.0027115 | JASPAR |
| HNF1B | 0.0035037 | JASPAR |
BED file downloads
Top 10 Example Regions
| Location | Gene Link | Dist. |
|---|---|---|
| chr1: 145571520-145571670 | ITGA10 | 38.13 |
| chr1: 145571520-145571670 | RP11-315I20.3 | 38.13 |
| chr9: 133658320-133658470 | ABL1 | 40.12 |
| chrX: 128873660-128873810 | XPNPEP2 | 40.55 |
| chr10: 120558040-120558190 | CACUL1 | 42.01 |
| chr1: 26161500-26161650 | MAN1C1 | 50.7 |
| chr8: 49439620-49439770 | AC026904.1 | 55.13 |
| chr11: 103249740-103249890 | DYNC2H1 | 58.76 |
| chr1: 78938020-78938170 | PTGFR | 59.64 |
| chr13: 103629940-103630090 | SLC10A2 | 59.75 |