SOM cluster: 610
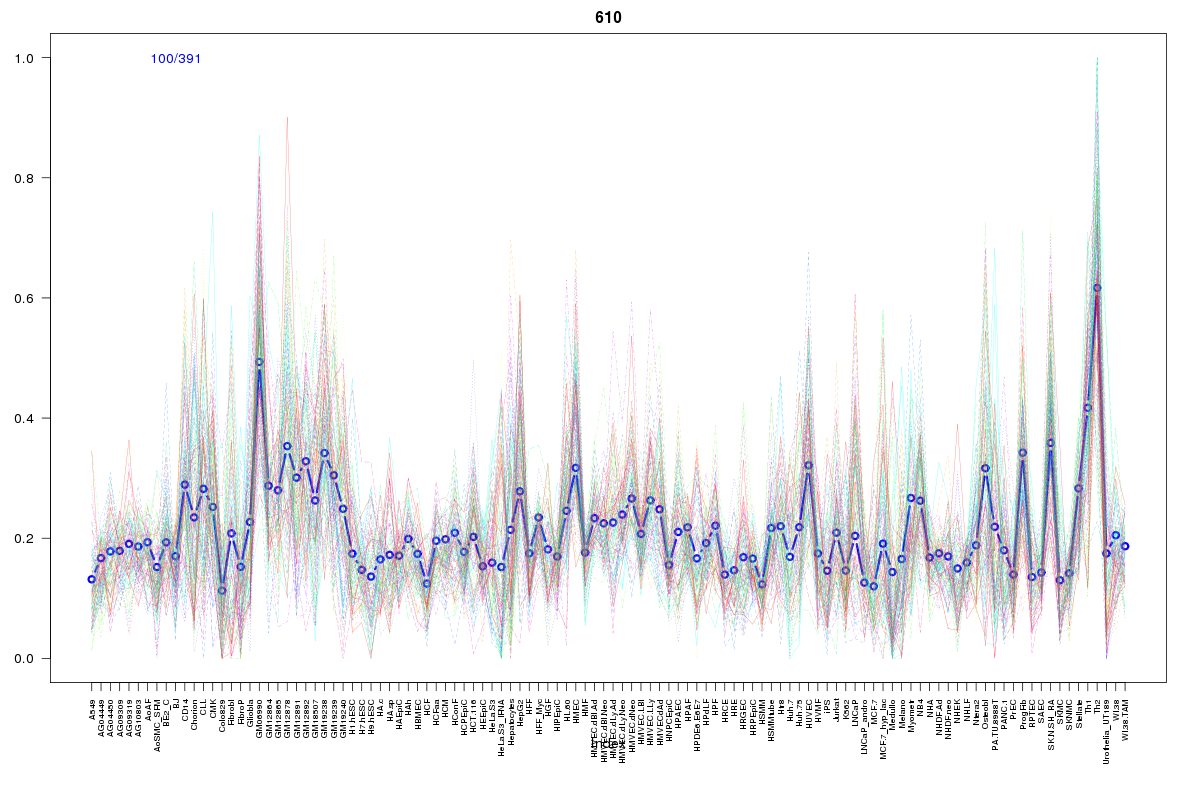
Cluster Hypersensitivity Profile

Genomic Location Trend
These plots show the distribution of the DHS sites surrounding the Transcript Start Site of the nearest gene.
Stats
Number of sites: 391Promoter: 26%
CpG-Island: 90%
Conserved: 56%
Enriched Motifs & Matches
Match Detail: [Jaspar]
|
| ||
|---|---|---|
| Sites: 94/100 | e-val: 0 | ||
| Factor | e-val(match) | DB |
| SP1 | 0.00060605 | JASPAR |
| Klf4 | 0.00081251 | JASPAR |
| TFAP2A | 0.0051455 | JASPAR |
| NHLH1 | 0.0077114 | JASPAR |
| Zfx | 0.0090228 | JASPAR |
|
| ||
| Sites: 47/100 | e-val: 0.0063 | ||
| Factor | e-val(match) | DB |
| TFAP2A | 0.0000081519 | JASPAR |
| SP1 | 0.00089255 | JASPAR |
| Klf4 | 0.005029 | JASPAR |
| ELK4 | 0.0094606 | JASPAR |
| GABPA | 0.013244 | JASPAR |
BED file downloads
Top 10 Example Regions
| Location | Gene Link | Dist. |
|---|---|---|
| chr5: 176561545-176561695 | ZNF346 | 42.07 |
| chr1: 951560-951710 | RP11-54O7.3 | 46.12 |
| chr12: 117627540-117627690 | TESC | 46.91 |
| chr12: 117627540-117627690 | RP11-103B5.2 | 46.91 |
| chr10: 15902020-15902170 | snoU13 | 51.63 |
| chr8: 60031620-60031770 | TOX | 51.94 |
| chr10: 88731385-88731535 | RNU1-19P | 53.74 |
| chr19: 16189185-16189335 | CIB3 | 53.96 |
| chr1: 16767880-16768030 | SPATA21 | 55.2 |
| chr1: 16767880-16768030 | NECAP2 | 55.2 |