SOM cluster: 625
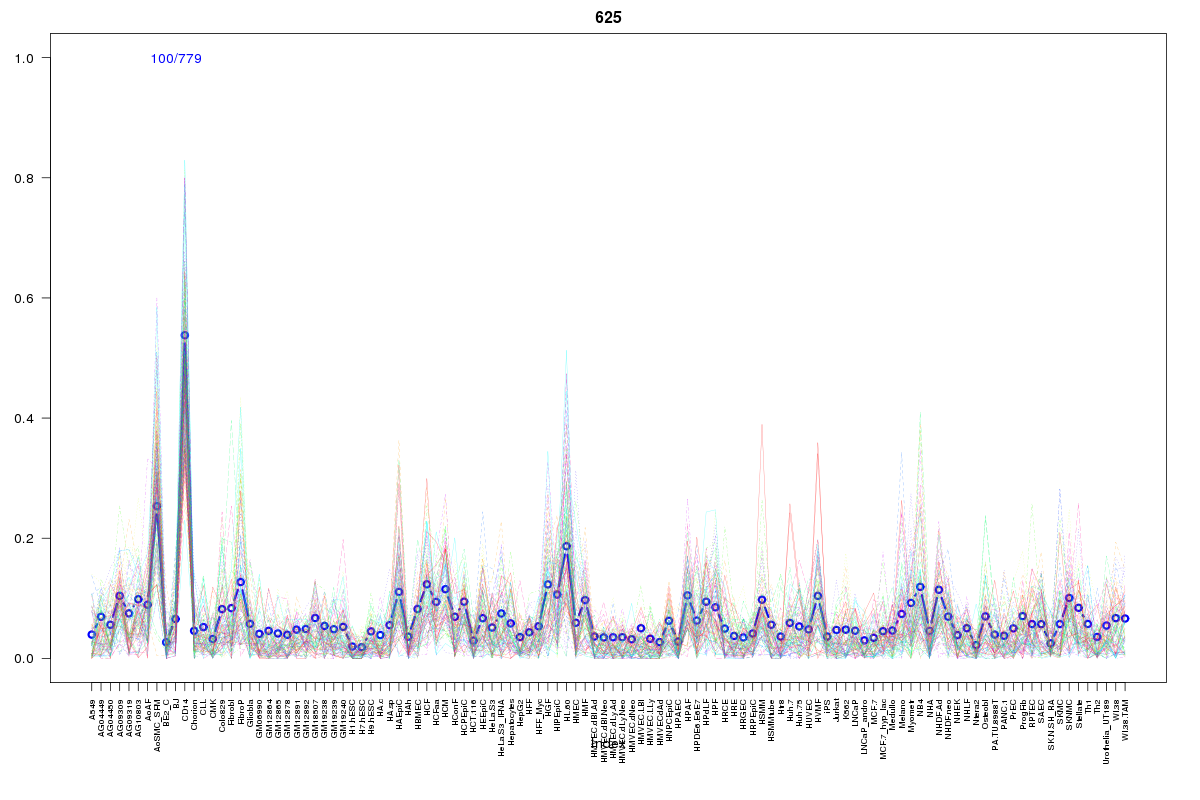
Cluster Hypersensitivity Profile

Genomic Location Trend
These plots show the distribution of the DHS sites surrounding the Transcript Start Site of the nearest gene.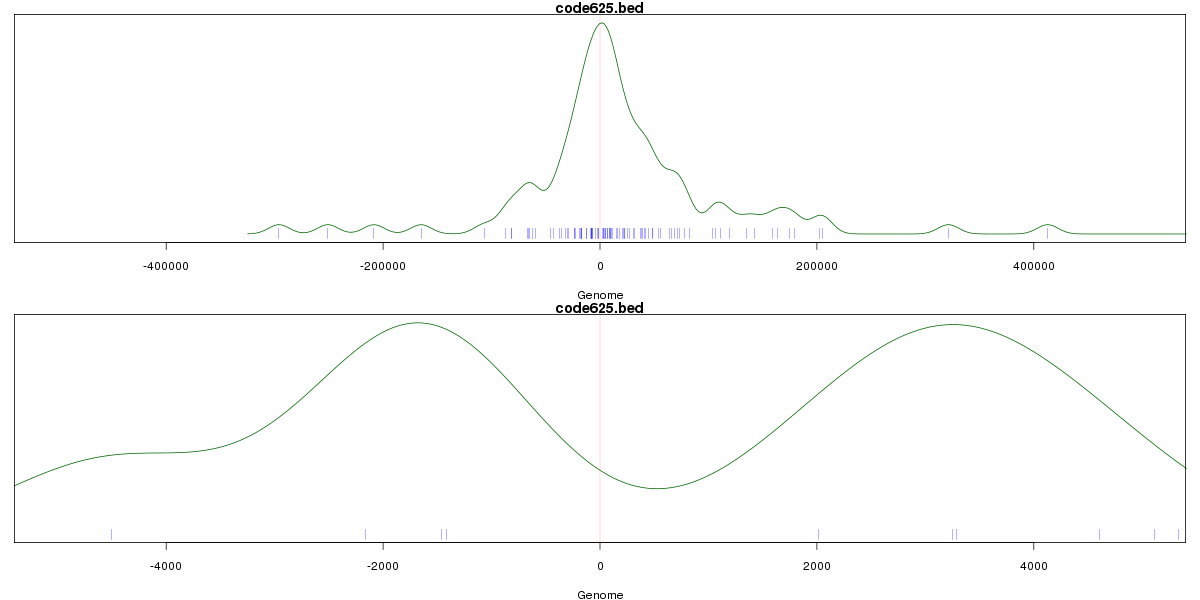
Stats
Number of sites: 779Promoter: 2%
CpG-Island: 0%
Conserved: 20%
Enriched Motifs & Matches
Match Detail: [Jaspar]
|
| ||
|---|---|---|
| Sites: 19/100 | e-val: 0.0011 | ||
| Factor | e-val(match) | DB |
| HNF1A | 0.000040498 | JASPAR |
| ARID3A | 0.000088288 | JASPAR |
| Lhx3 | 0.00010688 | JASPAR |
| HNF1B | 0.00013328 | JASPAR |
| Sox2 | 0.00021347 | JASPAR |
|
| ||
| Sites: 33/100 | e-val: 0.00015 | ||
| Factor | e-val(match) | DB |
| NFIL3 | 0.0000054385 | JASPAR |
| CEBPA | 0.0000084188 | JASPAR |
| HLF | 0.000034196 | JASPAR |
| T | 0.0012429 | JASPAR |
| znf143 | 0.0037776 | JASPAR |