SOM cluster: 631
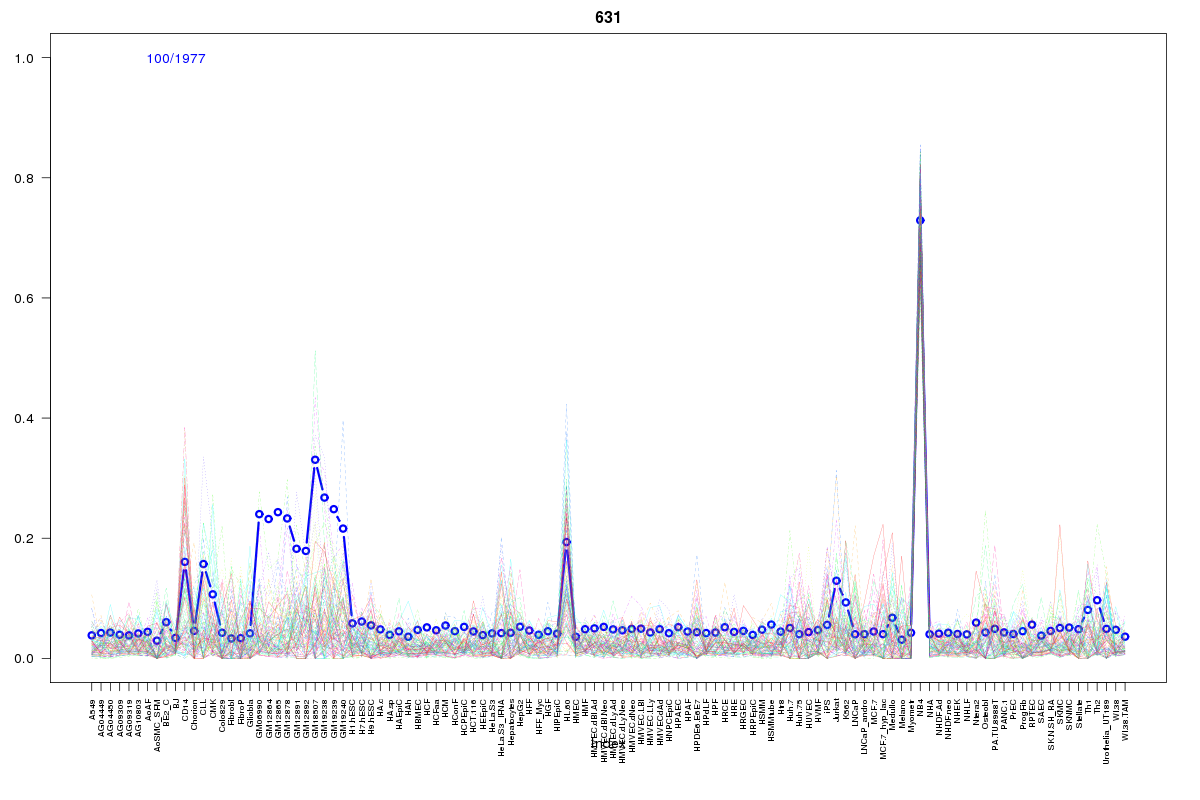
Cluster Hypersensitivity Profile

Genomic Location Trend
These plots show the distribution of the DHS sites surrounding the Transcript Start Site of the nearest gene.
Stats
Number of sites: 1977Promoter: 2%
CpG-Island: 0%
Conserved: 14%
Enriched Motifs & Matches
Match Detail: [Jaspar]
|
| ||
|---|---|---|
| Sites: 12/100 | e-val: 0.03 | ||
| Factor | e-val(match) | DB |
| EWSR1-FLI1 | 0.000000026105 | JASPAR |
| SP1 | 0.0000086457 | JASPAR |
| Tal1::Gata1 | 0.00031279 | JASPAR |
| Pax4 | 0.00060463 | JASPAR |
| SPIB | 0.0022031 | JASPAR |
BED file downloads
Top 10 Example Regions
| Location | Gene Link | Dist. |
|---|---|---|
| chr7: 106193100-106193250 | CTB-111H14.1 | 39.62 |
| chr12: 93843200-93843350 | UBE2N | 42.43 |
| chr1: 154916660-154916810 | SHC1 | 48.8 |
| chr1: 154916660-154916810 | PBXIP1 | 48.8 |
| chr12: 102249900-102250050 | HSPE1P4 | 49.88 |
| chr8: 102258500-102258650 | ZNF706 | 51.67 |
| chr15: 101782720-101782870 | SNRPA1 | 52.61 |
| chr7: 38322820-38322970 | TRGJP1 | 53.72 |
| chr7: 38322820-38322970 | TRGV10 | 53.72 |
| chr7: 38322820-38322970 | TRGV9 | 53.72 |