SOM cluster: 637
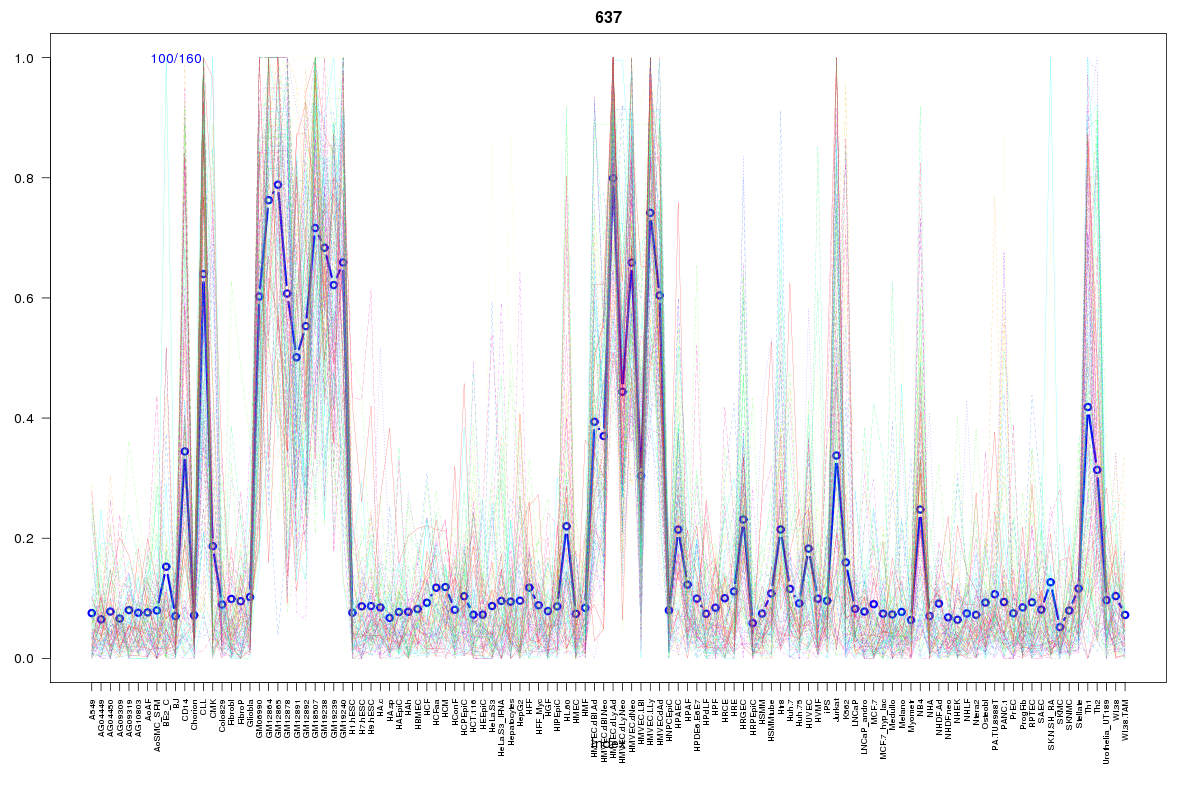
Cluster Hypersensitivity Profile

Genomic Location Trend
These plots show the distribution of the DHS sites surrounding the Transcript Start Site of the nearest gene.
Stats
Number of sites: 160Promoter: 5%
CpG-Island: 1%
Conserved: 43%
Enriched Motifs & Matches
Match Detail: [Jaspar]
|
| ||
|---|---|---|
| Sites: 56/100 | e-val: 9.8e-16 | ||
| Factor | e-val(match) | DB |
| FEV | 0.00000024776 | JASPAR |
| SPI1 | 0.00000083627 | JASPAR |
| SPIB | 0.0000012241 | JASPAR |
| Stat3 | 0.0000014234 | JASPAR |
| ELK4 | 0.0000021348 | JASPAR |
BED file downloads
Top 10 Example Regions
| Location | Gene Link | Dist. |
|---|---|---|
| chr18: 13611080-13611230 | LDLRAD4 | 51.23 |
| chr5: 150005565-150005715 | DCTN4 | 51.68 |
| chr5: 150005565-150005715 | snoU13 | 51.68 |
| chr8: 80680900-80681050 | HEY1 | 53.45 |
| chr1: 203350460-203350610 | BTG2 | 60.14 |
| chr13: 41558900-41559050 | ELF1 | 63.82 |
| chr19: 49379700-49379850 | PPP1R15A | 67.98 |
| chr19: 49379700-49379850 | HSD17B14 | 67.98 |
| chr19: 49379700-49379850 | TULP2 | 67.98 |
| chr5: 137795100-137795250 | REEP2 | 70.35 |