SOM cluster: 64
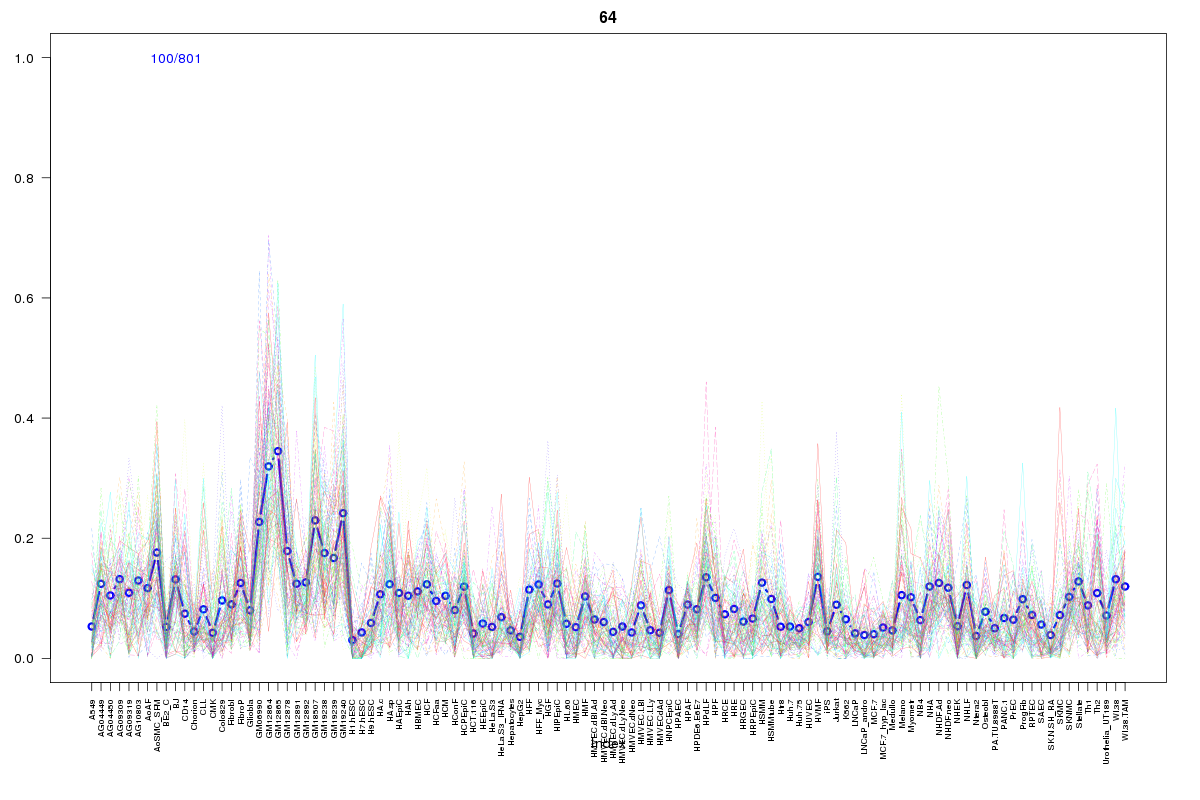
Cluster Hypersensitivity Profile

Genomic Location Trend
These plots show the distribution of the DHS sites surrounding the Transcript Start Site of the nearest gene.
Stats
Number of sites: 801Promoter: 2%
CpG-Island: 0%
Conserved: 36%
Enriched Motifs & Matches
Match Detail: [Jaspar]
|
| ||
|---|---|---|
| Sites: 33/100 | e-val: 9.1e-17 | ||
| Factor | e-val(match) | DB |
| IRF1 | 0.000014463 | JASPAR |
| IRF2 | 0.00006571 | JASPAR |
| MEF2A | 0.00021888 | JASPAR |
| FOXO3 | 0.0008117 | JASPAR |
| NFATC2 | 0.0058491 | JASPAR |
|
| ||
| Sites: 25/100 | e-val: 0.00000096 | ||
| Factor | e-val(match) | DB |
| IRF1 | 0.0011923 | JASPAR |
| SOX10 | 0.002136 | JASPAR |
| NFATC2 | 0.0027118 | JASPAR |
| FOXA1 | 0.0048161 | JASPAR |
| SPIB | 0.0054393 | JASPAR |
BED file downloads
Top 10 Example Regions
| Location | Gene Link | Dist. |
|---|---|---|
| chr11: 64920320-64920470 | SLC22A20 | 31.56 |
| chr12: 27093900-27094050 | FGFR1OP2 | 49.15 |
| chr3: 41888480-41888630 | ATP6V0E1P2 | 49.47 |
| chr7: 115864660-115864810 | TES | 51.37 |
| chr7: 116891765-116891915 | WNT2 | 53.44 |
| chr7: 116891765-116891915 | AC006326.3 | 53.44 |
| chr7: 69359040-69359190 | AUTS2 | 61.33 |
| chr5: 77863020-77863170 | LHFPL2 | 61.6 |
| chr2: 30938000-30938150 | LCLAT1 | 64.06 |
| chr22: 34250025-34250175 | LARGE | 64.14 |