SOM cluster: 644
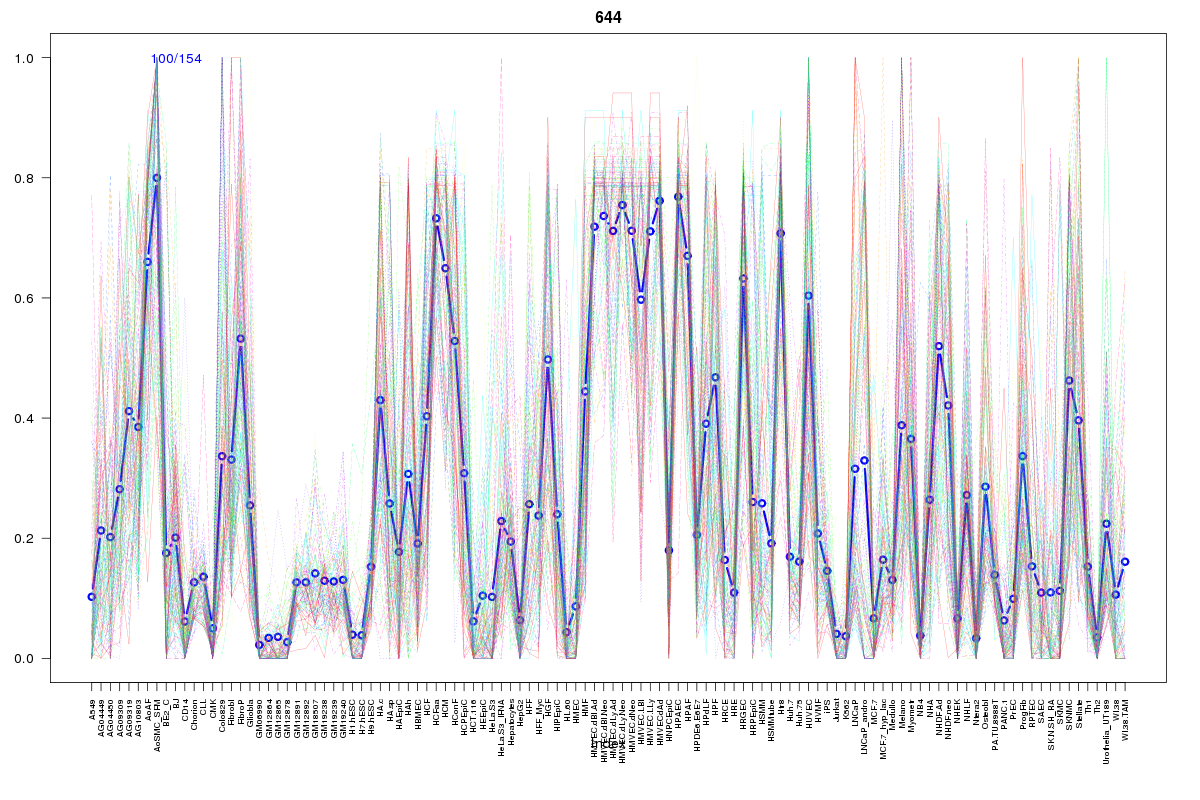
Cluster Hypersensitivity Profile

Genomic Location Trend
These plots show the distribution of the DHS sites surrounding the Transcript Start Site of the nearest gene.
Stats
Number of sites: 154Promoter: 4%
CpG-Island: 0%
Conserved: 67%
Enriched Motifs & Matches
Match Detail: [Jaspar]
|
| ||
|---|---|---|
| Sites: 30/100 | e-val: 0.00000024 | ||
| Factor | e-val(match) | DB |
| TLX1::NFIC | 0.000000084675 | JASPAR |
| NFIC | 0.00071611 | JASPAR |
| INSM1 | 0.005454 | JASPAR |
| E2F1 | 0.063083 | JASPAR |
| ESR1 | 0.063211 | JASPAR |
BED file downloads
Top 10 Example Regions
| Location | Gene Link | Dist. |
|---|---|---|
| chr8: 102405400-102405550 | GRHL2 | 46.37 |
| chr2: 64631185-64631335 | AC008074.3 | 47.53 |
| chr11: 4046960-4047110 | RRM1 | 47.56 |
| chr17: 1989020-1989170 | HIC1 | 48.27 |
| chr17: 1989020-1989170 | SMG6 | 48.27 |
| chr9: 129798260-129798410 | ANGPTL2 | 54.37 |
| chr17: 62392660-62392810 | POLG2 | 56.6 |
| chr3: 48542220-48542370 | SHISA5 | 57.11 |
| chr3: 48542220-48542370 | UQCRC1 | 57.11 |
| chr3: 48542220-48542370 | RP11-24C3.2 | 57.11 |