SOM cluster: 660
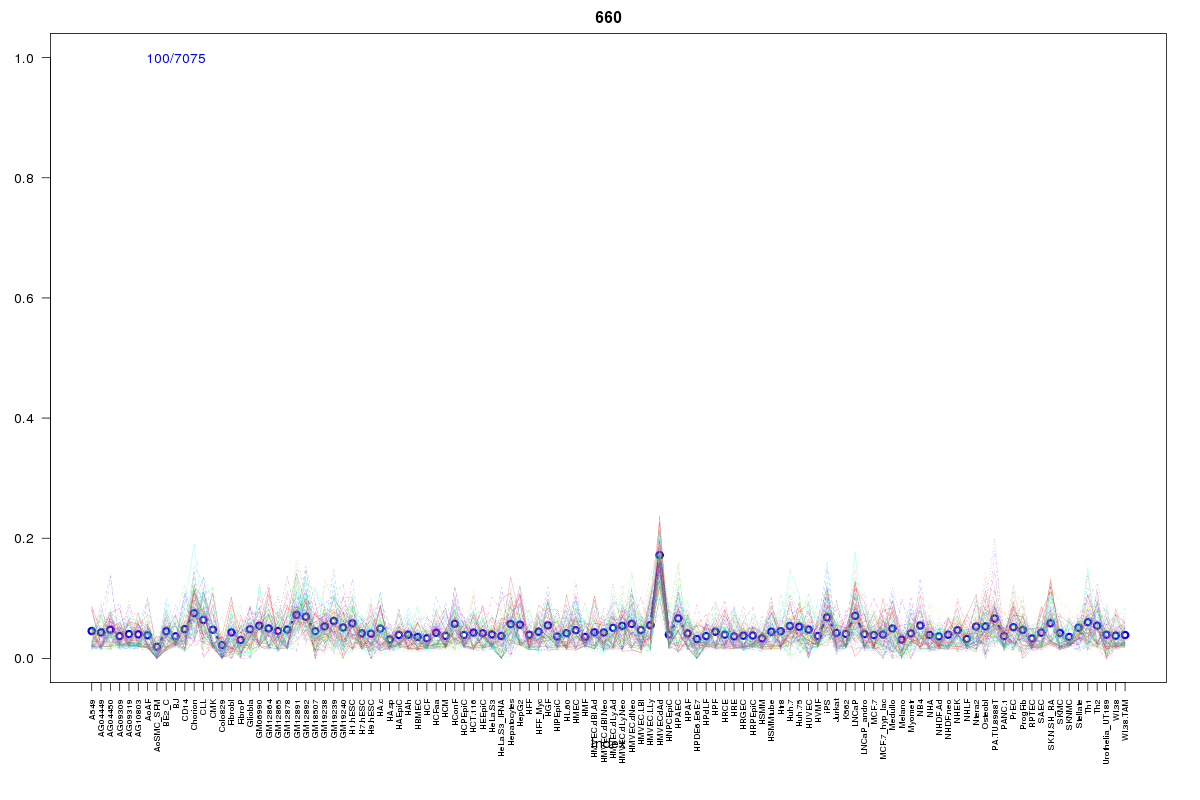
Cluster Hypersensitivity Profile

Genomic Location Trend
These plots show the distribution of the DHS sites surrounding the Transcript Start Site of the nearest gene.
Stats
Number of sites: 7075Promoter: 1%
CpG-Island: 3%
Conserved: 20%
Enriched Motifs & Matches
Match Detail: [Jaspar]
|
| ||
|---|---|---|
| Sites: 55/100 | e-val: 6.6e-26 | ||
| Factor | e-val(match) | DB |
| SP1 | 0.00000095603 | JASPAR |
| INSM1 | 0.00003312 | JASPAR |
| PPARG::RXRA | 0.000073165 | JASPAR |
| TLX1::NFIC | 0.0027044 | JASPAR |
| HNF4A | 0.0047247 | JASPAR |
|
| ||
| Sites: 38/100 | e-val: 0.00000000088 | ||
| Factor | e-val(match) | DB |
| PLAG1 | 0.00090981 | JASPAR |
| INSM1 | 0.0047713 | JASPAR |
| Zfp423 | 0.008252 | JASPAR |
| REST | 0.023833 | JASPAR |
| Egr1 | 0.051277 | JASPAR |
|
| ||
| Sites: 50/100 | e-val: 0.00014 | ||
| Factor | e-val(match) | DB |
| Pax4 | 0.00000010939 | JASPAR |
| SP1 | 0.00000077517 | JASPAR |
| RREB1 | 0.0000095093 | JASPAR |
| PLAG1 | 0.00025833 | JASPAR |
| Tal1::Gata1 | 0.00070704 | JASPAR |
|
| ||
| Sites: 22/100 | e-val: 0.0016 | ||
| Factor | e-val(match) | DB |
| Pax4 | 0.0000070772 | JASPAR |
| RREB1 | 0.000053614 | JASPAR |
| Klf4 | 0.00043297 | JASPAR |
| SP1 | 0.0036321 | JASPAR |
| Egr1 | 0.0045832 | JASPAR |
|
| ||
| Sites: 20/100 | e-val: 0.9 | ||
| Factor | e-val(match) | DB |
| EBF1 | 0.00001672 | JASPAR |
| CTCF | 0.00011624 | JASPAR |
| ZEB1 | 0.00023146 | JASPAR |
| Zfp423 | 0.00078069 | JASPAR |
| TFAP2A | 0.00096695 | JASPAR |
BED file downloads
Top 10 Example Regions
| Location | Gene Link | Dist. |
|---|---|---|
| chr1: 149890305-149890455 | SV2A | 18.21 |
| chr1: 145587625-145587775 | POLR3C | 22.88 |
| chr1: 145587625-145587775 | RNF115 | 22.88 |
| chr22: 21810020-21810170 | RN7SKP221 | 26.21 |
| chr22: 21810020-21810170 | RIMBP3C | 26.21 |
| chr9: 133914720-133914870 | RNU6-881P | 38.4 |
| chr9: 133914720-133914870 | RP11-544A12.4 | 38.4 |
| chr4: 8590145-8590295 | RP11-689P11.2 | 38.92 |
| chr3: 50459165-50459315 | NPRL2 | 43.95 |
| chr3: 38163785-38163935 | OXSR1 | 43.97 |