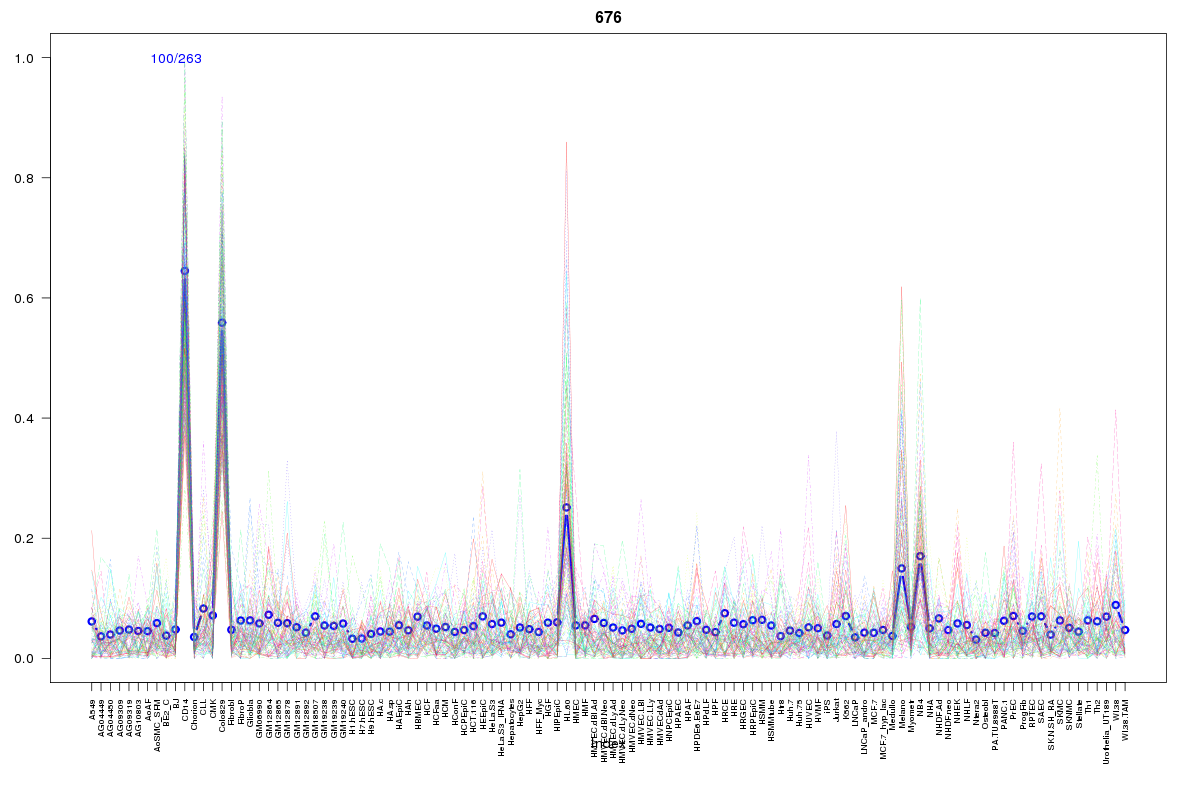
SOM cluster: 676
Cluster Hypersensitivity Profile

Genomic Location Trend
These plots show the distribution of the DHS sites surrounding the Transcript Start Site of the nearest gene.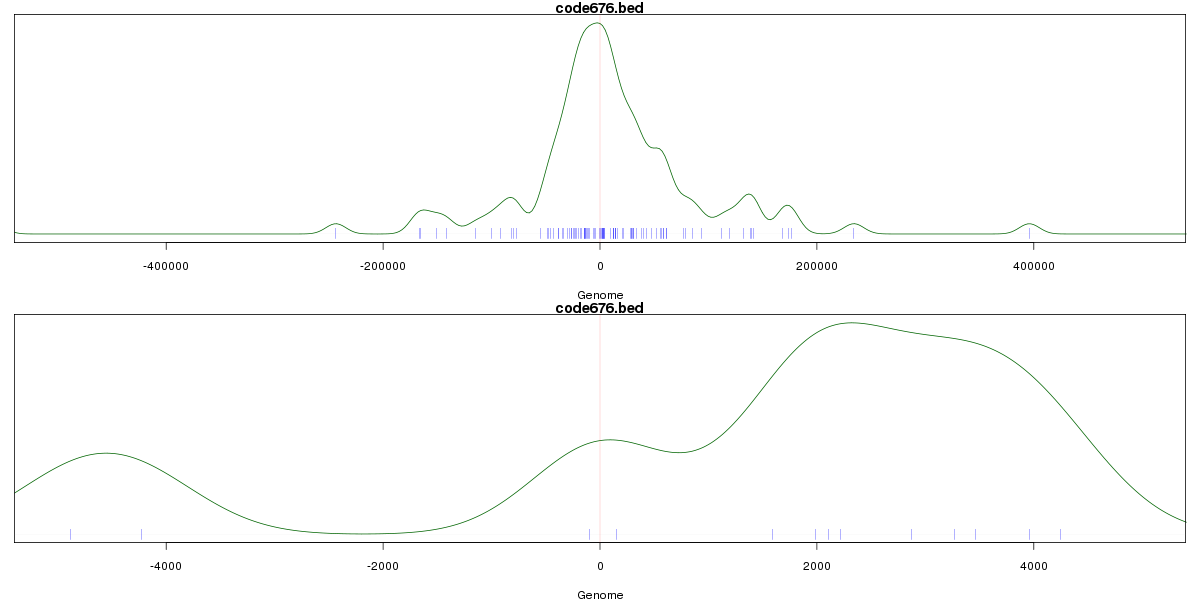
Stats
Number of sites: 263Promoter: 2%
CpG-Island: 0%
Conserved: 30%
Enriched Motifs & Matches
Match Detail: [Jaspar]
|
| ||
|---|---|---|
| Sites: 50/100 | e-val: 4.7e-19 | ||
| Factor | e-val(match) | DB |
| SPI1 | 0.000000014893 | JASPAR |
| FEV | 0.0000027823 | JASPAR |
| SPIB | 0.0000316 | JASPAR |
| ELF5 | 0.000034282 | JASPAR |
| EWSR1-FLI1 | 0.000047927 | JASPAR |
|
| ||
| Sites: 21/100 | e-val: 0.2 | ||
| Factor | e-val(match) | DB |
| MEF2A | 0.00080262 | JASPAR |
| Pou5f1 | 0.0024517 | JASPAR |
| ARID3A | 0.0036288 | JASPAR |
| NFATC2 | 0.0044146 | JASPAR |
| Sox2 | 0.010444 | JASPAR |
BED file downloads
Top 10 Example Regions
| Location | Gene Link | Dist. |
|---|---|---|
| chr7: 141811300-141811450 | MGAM | 37.38 |
| chr12: 57512720-57512870 | STAT6 | 56.84 |
| chr9: 93908960-93909110 | LINC00484 | 67.41 |
| chr9: 93908960-93909110 | RP11-305L7.3 | 67.41 |
| chr6: 137608180-137608330 | IFNGR1 | 67.41 |
| chr8: 38660800-38660950 | RP11-723D22.2 | 70.07 |
| chr6: 138096480-138096630 | TNFAIP3 | 71.32 |
| chr6: 2952060-2952210 | SERPINB8P1 | 75.09 |
| chr4: 154668580-154668730 | RP11-153M7.3 | 77.39 |
| chr7: 38283060-38283210 | TRGV9 | 78.84 |