SOM cluster: 693
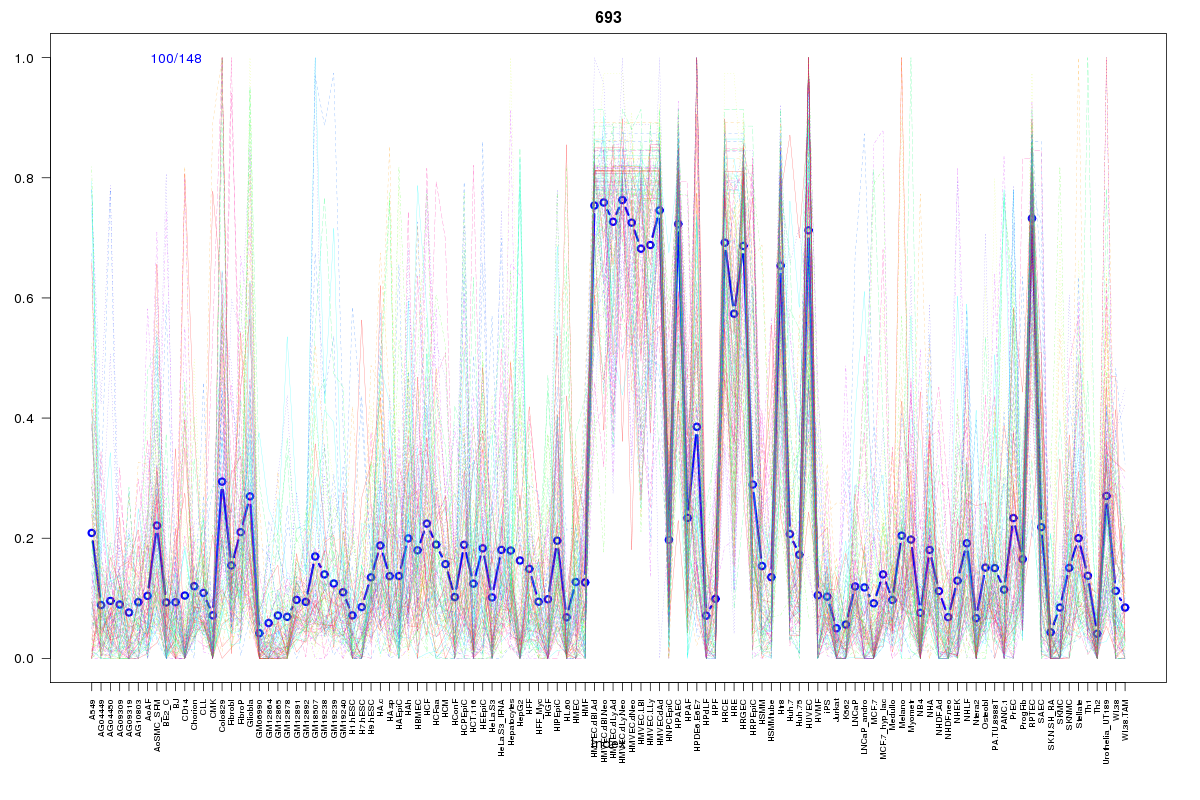
Cluster Hypersensitivity Profile

Genomic Location Trend
These plots show the distribution of the DHS sites surrounding the Transcript Start Site of the nearest gene.
Stats
Number of sites: 148Promoter: 2%
CpG-Island: 0%
Conserved: 48%
Enriched Motifs & Matches
Match Detail: [Jaspar]
|
| ||
|---|---|---|
| Sites: 21/100 | e-val: 0.95 | ||
| Factor | e-val(match) | DB |
| AP1 | 0.000000015512 | JASPAR |
| NFE2L2 | 0.000024365 | JASPAR |
| PPARG | 0.012246 | JASPAR |
| NR4A2 | 0.018032 | JASPAR |
| HOXA5 | 0.029903 | JASPAR |
BED file downloads
Top 10 Example Regions
| Location | Gene Link | Dist. |
|---|---|---|
| chr12: 12037720-12037870 | ETV6 | 42.69 |
| chr4: 146726840-146726990 | ZNF827 | 59.13 |
| chr18: 60087420-60087570 | TNFRSF11A | 65.19 |
| chr13: 100752300-100752450 | NDUFA12P1 | 66.66 |
| chr13: 77373940-77374090 | KCTD12 | 69.6 |
| chr8: 104164340-104164490 | C8orf56 | 71.82 |
| chr10: 3816240-3816390 | KLF6 | 73.09 |
| chr10: 3816240-3816390 | RP11-184A2.3 | 73.09 |
| chr9: 71985440-71985590 | FAM189A2 | 77.24 |
| chr11: 76596540-76596690 | ACER3 | 78.79 |