SOM cluster: 730
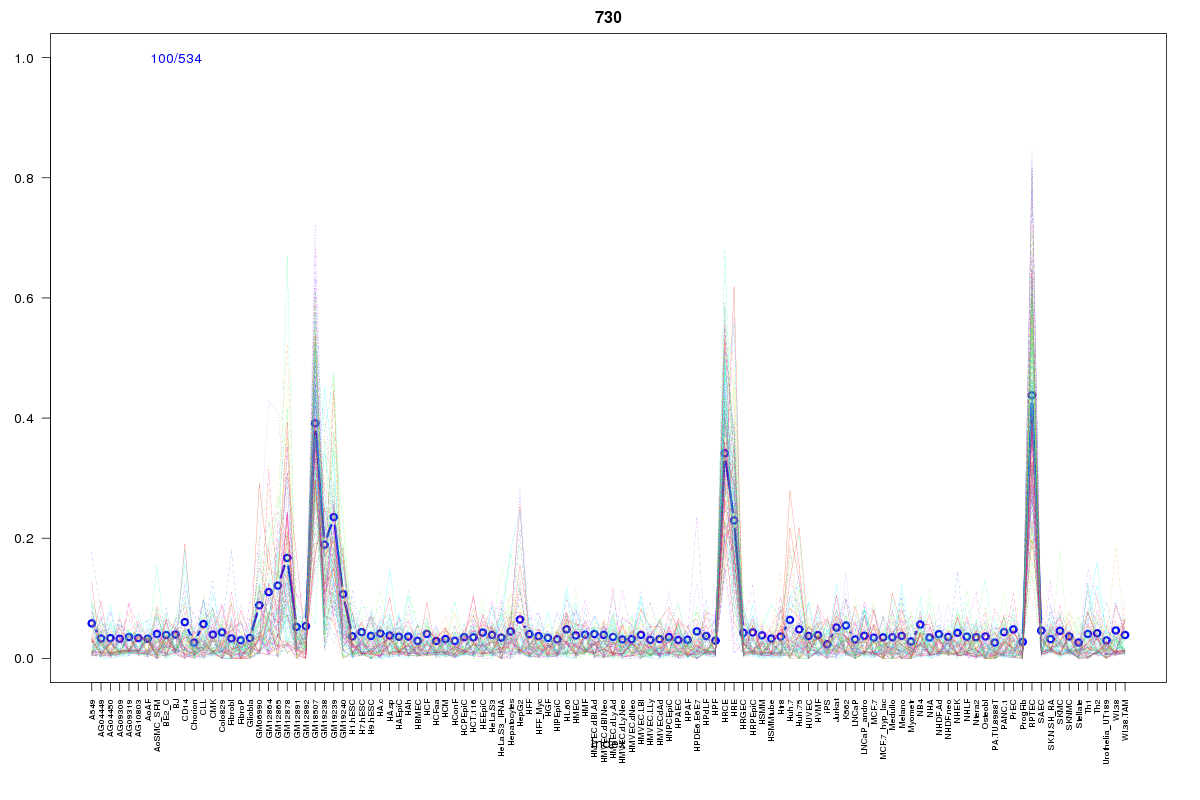
Cluster Hypersensitivity Profile

Genomic Location Trend
These plots show the distribution of the DHS sites surrounding the Transcript Start Site of the nearest gene.
Stats
Number of sites: 534Promoter: 3%
CpG-Island: 1%
Conserved: 28%
Enriched Motifs & Matches
Match Detail: [Jaspar]
|
| ||
|---|---|---|
| Sites: 52/100 | e-val: 0 | ||
| Factor | e-val(match) | DB |
| HNF1A | 0.0000000000027556 | JASPAR |
| HNF1B | 0.00000000010486 | JASPAR |
| Lhx3 | 0.000053241 | JASPAR |
| Prrx2 | 0.0013834 | JASPAR |
| ARID3A | 0.0029416 | JASPAR |
BED file downloads
Top 10 Example Regions
| Location | Gene Link | Dist. |
|---|---|---|
| chr7: 140293420-140293570 | ADCK2 | 45.09 |
| chr11: 13904640-13904790 | SPON1 | 45.29 |
| chr4: 25729505-25729655 | SLC34A2 | 50.93 |
| chr3: 134650380-134650530 | EPHB1 | 52.7 |
| chr4: 187069620-187069770 | CYP4V2 | 53.64 |
| chr4: 187069620-187069770 | RP11-173M11.2 | 53.64 |
| chr4: 187069620-187069770 | FAM149A | 53.64 |
| chr8: 55660840-55660990 | RP11-56A10.1 | 57.67 |
| chr10: 27069440-27069590 | ABI1 | 59.5 |
| chr1: 60285580-60285730 | HOOK1 | 61.5 |