SOM cluster: 733
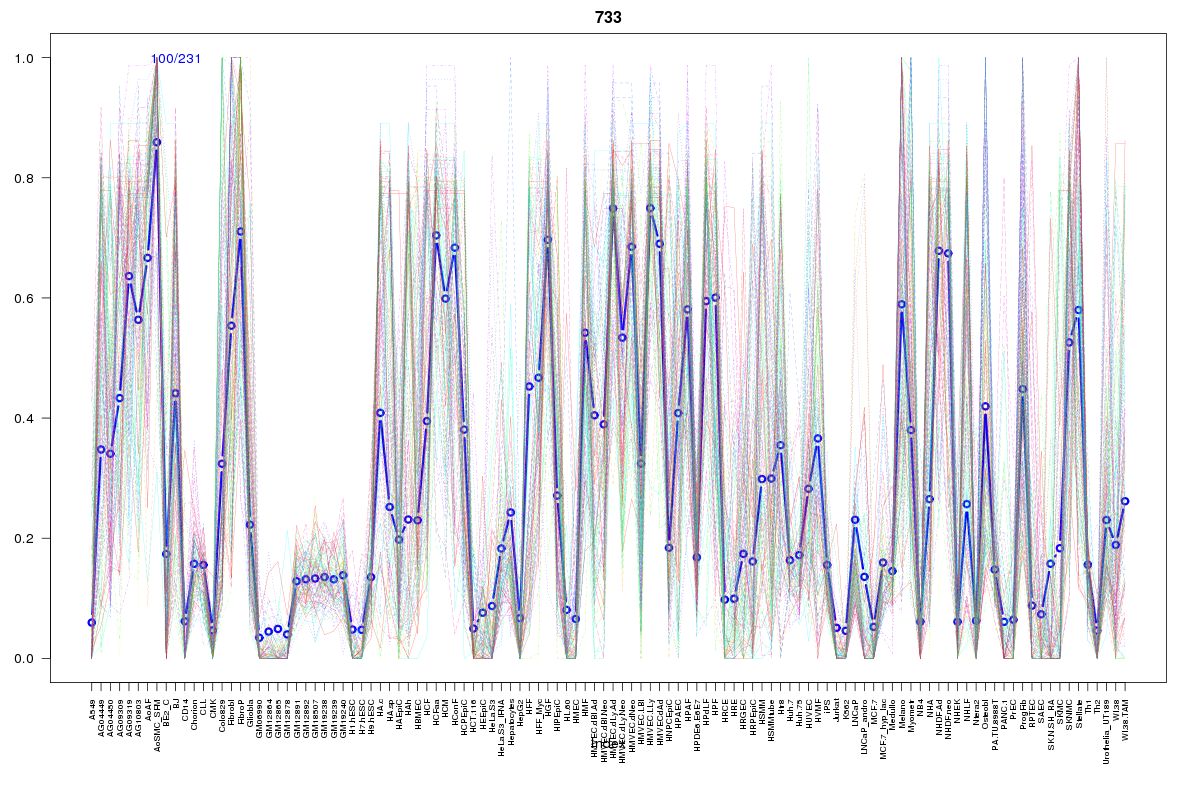
Cluster Hypersensitivity Profile

Genomic Location Trend
These plots show the distribution of the DHS sites surrounding the Transcript Start Site of the nearest gene.
Stats
Number of sites: 231Promoter: 0%
CpG-Island: 1%
Conserved: 75%
Enriched Motifs & Matches
Match Detail: [Jaspar]
|
| ||
|---|---|---|
| Sites: 38/100 | e-val: 0.0015 | ||
| Factor | e-val(match) | DB |
| Foxd3 | 0.0000000030476 | JASPAR |
| FOXI1 | 0.0000014451 | JASPAR |
| FOXF2 | 0.000082268 | JASPAR |
| FOXO3 | 0.00013995 | JASPAR |
| Foxq1 | 0.0001597 | JASPAR |
|
| ||
| Sites: 19/100 | e-val: 0.47 | ||
| Factor | e-val(match) | DB |
| Stat3 | 0.00000045152 | JASPAR |
| NFATC2 | 0.0000012129 | JASPAR |
| SPI1 | 0.0045646 | JASPAR |
| FEV | 0.004807 | JASPAR |
| Myb | 0.012611 | JASPAR |
BED file downloads
Top 10 Example Regions
| Location | Gene Link | Dist. |
|---|---|---|
| chr8: 124502740-124502890 | FBXO32 | 32.43 |
| chr9: 128288620-128288770 | HNRNPA1P15 | 35.18 |
| chr1: 53421160-53421310 | ZYG11A | 51.68 |
| chr1: 171111260-171111410 | FMO2 | 52.39 |
| chr1: 171111640-171111790 | MROH9 | 52.68 |
| chr1: 171111640-171111790 | FMO6P | 52.68 |
| chr1: 171111640-171111790 | RP1-127D3.4 | 52.68 |
| chr9: 117369240-117369390 | ATP6V1G1 | 52.87 |
| chr22: 19650880-19651030 | SEPT5 | 54.28 |
| chr9: 131901020-131901170 | CRAT | 56.57 |