SOM cluster: 743
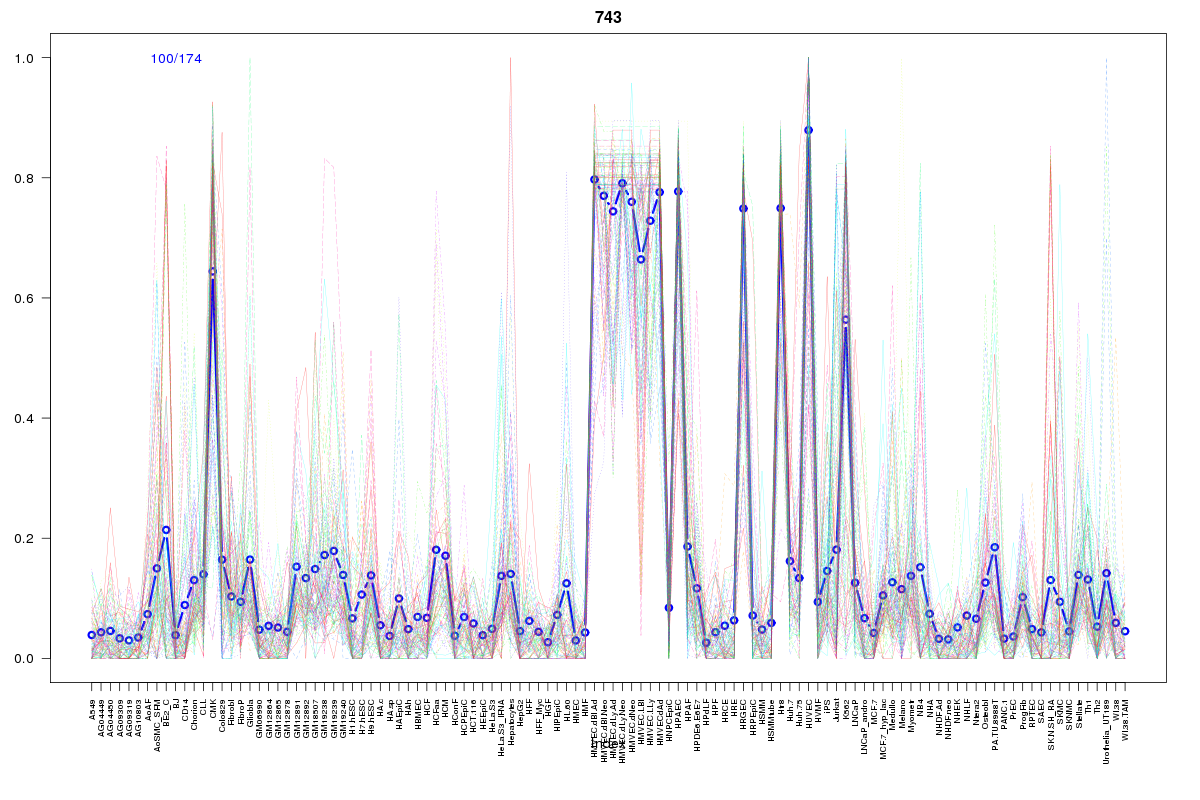
Cluster Hypersensitivity Profile

Genomic Location Trend
These plots show the distribution of the DHS sites surrounding the Transcript Start Site of the nearest gene.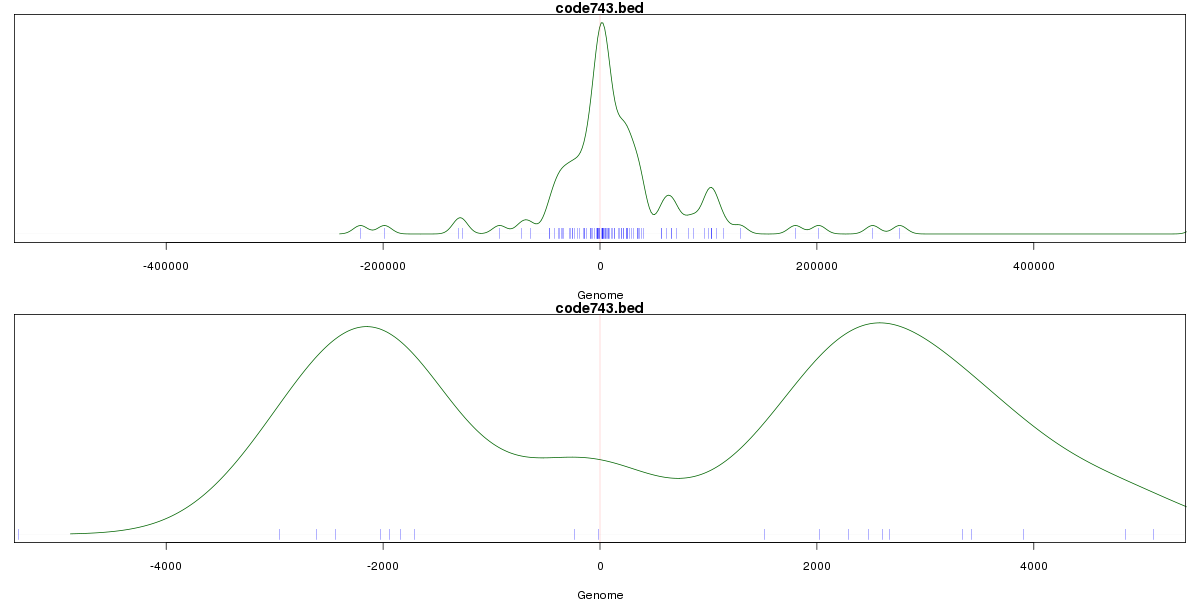
Stats
Number of sites: 174Promoter: 5%
CpG-Island: 0%
Conserved: 56%
Enriched Motifs & Matches
Match Detail: [Jaspar]
|
| ||
|---|---|---|
| Sites: 70/100 | e-val: 5.8e-27 | ||
| Factor | e-val(match) | DB |
| FEV | 0.0000000078455 | JASPAR |
| Stat3 | 0.00000053425 | JASPAR |
| ELK4 | 0.0000011709 | JASPAR |
| SPIB | 0.0000018701 | JASPAR |
| SPI1 | 0.0000059395 | JASPAR |
|
| ||
| Sites: 39/100 | e-val: 0.00099 | ||
| Factor | e-val(match) | DB |
| Gata1 | 0.000000023362 | JASPAR |
| Evi1 | 0.0000026768 | JASPAR |
| Tal1::Gata1 | 0.00010219 | JASPAR |
| GATA2 | 0.0024109 | JASPAR |
| GATA3 | 0.0071318 | JASPAR |
|
| ||
| Sites: 19/100 | e-val: 0.0017 | ||
| Factor | e-val(match) | DB |
| SP1 | 0.000000097406 | JASPAR |
| Pax4 | 0.0000084306 | JASPAR |
| Klf4 | 0.0021905 | JASPAR |
| MZF1_1-4 | 0.0026814 | JASPAR |
| RREB1 | 0.0033827 | JASPAR |