SOM cluster: 758
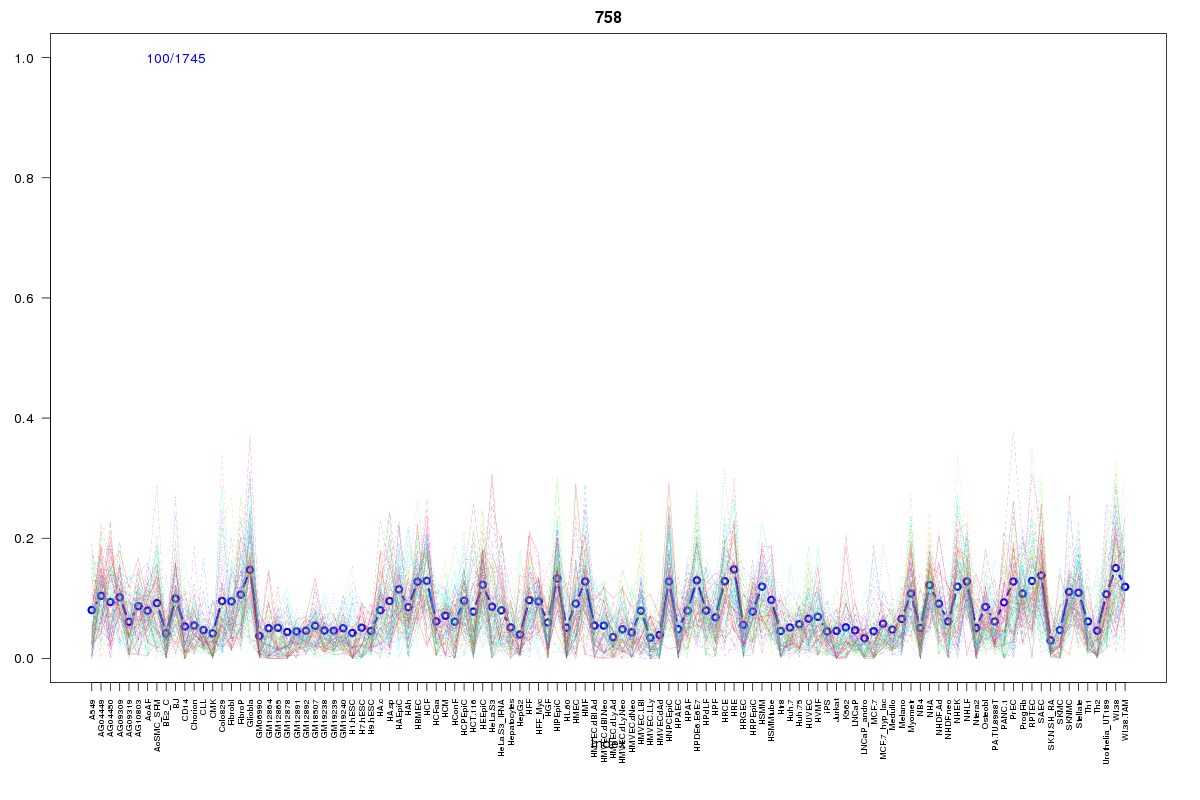
Cluster Hypersensitivity Profile

Genomic Location Trend
These plots show the distribution of the DHS sites surrounding the Transcript Start Site of the nearest gene.
Stats
Number of sites: 1745Promoter: 1%
CpG-Island: 0%
Conserved: 17%
Enriched Motifs & Matches
Match Detail: [Jaspar]
|
| ||
|---|---|---|
| Sites: 19/100 | e-val: 0.029 | ||
| Factor | e-val(match) | DB |
| AP1 | 0.0000000016875 | JASPAR |
| NFE2L2 | 0.00000018715 | JASPAR |
| PPARG | 0.0063192 | JASPAR |
| NR4A2 | 0.011666 | JASPAR |
| Pax2 | 0.013829 | JASPAR |
BED file downloads
Top 10 Example Regions
| Location | Gene Link | Dist. |
|---|---|---|
| chr13: 103053620-103053770 | FGF14-IT1 | 39.12 |
| chrX: 47065880-47066030 | snoU13 | 40.42 |
| chr1: 209836480-209836630 | G0S2 | 42.57 |
| chr3: 194294225-194294375 | ATP13A3 | 48.52 |
| chr8: 37350180-37350330 | RP11-150O12.1 | 49.5 |
| chr5: 141924785-141924935 | FGF1 | 50.09 |
| chr3: 124600900-124601050 | HEG1 | 50.9 |
| chrX: 14045420-14045570 | GPM6B | 53.86 |
| chr7: 116095660-116095810 | CAV2 | 53.93 |
| chr7: 116095660-116095810 | CAV1 | 53.93 |