SOM cluster: 763
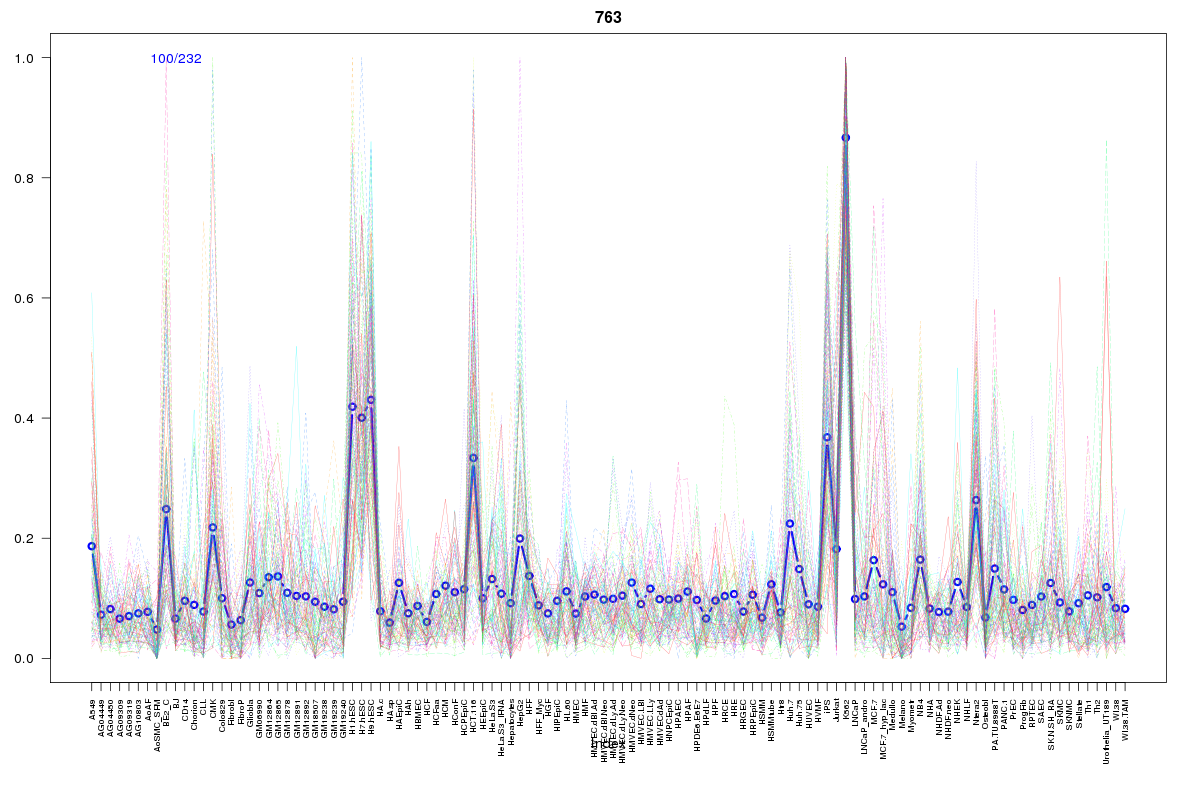
Cluster Hypersensitivity Profile

Genomic Location Trend
These plots show the distribution of the DHS sites surrounding the Transcript Start Site of the nearest gene.
Stats
Number of sites: 232Promoter: 4%
CpG-Island: 1%
Conserved: 25%
Enriched Motifs & Matches
Match Detail: [Jaspar]
|
| ||
|---|---|---|
| Sites: 53/100 | e-val: 1.1e-38 | ||
| Factor | e-val(match) | DB |
| SP1 | 0.0000000000037419 | JASPAR |
| Klf4 | 0.0000000054501 | JASPAR |
| Pax4 | 0.0000050178 | JASPAR |
| RREB1 | 0.000069347 | JASPAR |
| INSM1 | 0.0021358 | JASPAR |
|
| ||
| Sites: 36/100 | e-val: 0.00092 | ||
| Factor | e-val(match) | DB |
| Klf4 | 0.000000000038285 | JASPAR |
| SP1 | 0.0000061631 | JASPAR |
| Egr1 | 0.003325 | JASPAR |
| Tal1::Gata1 | 0.0035612 | JASPAR |
| TLX1::NFIC | 0.0088551 | JASPAR |
BED file downloads
Top 10 Example Regions
| Location | Gene Link | Dist. |
|---|---|---|
| chr6: 42061840-42061990 | GUCA1B | 42.88 |
| chr6: 42061840-42061990 | TAF8 | 42.88 |
| chr6: 42061840-42061990 | RP1-139D8.6 | 42.88 |
| chr16: 9090900-9091050 | USP7 | 58.51 |
| chr3: 171180160-171180310 | TNIK | 59.38 |
| chr3: 171180160-171180310 | RP11-185E8.1 | 59.38 |
| chr10: 104223220-104223370 | FBXL15 | 59.41 |
| chr10: 104223220-104223370 | TMEM180 | 59.41 |
| chr22: 21802445-21802595 | HIC2 | 60.4 |
| chr8: 102137165-102137315 | KB-1460A1.1 | 60.78 |