SOM cluster: 764
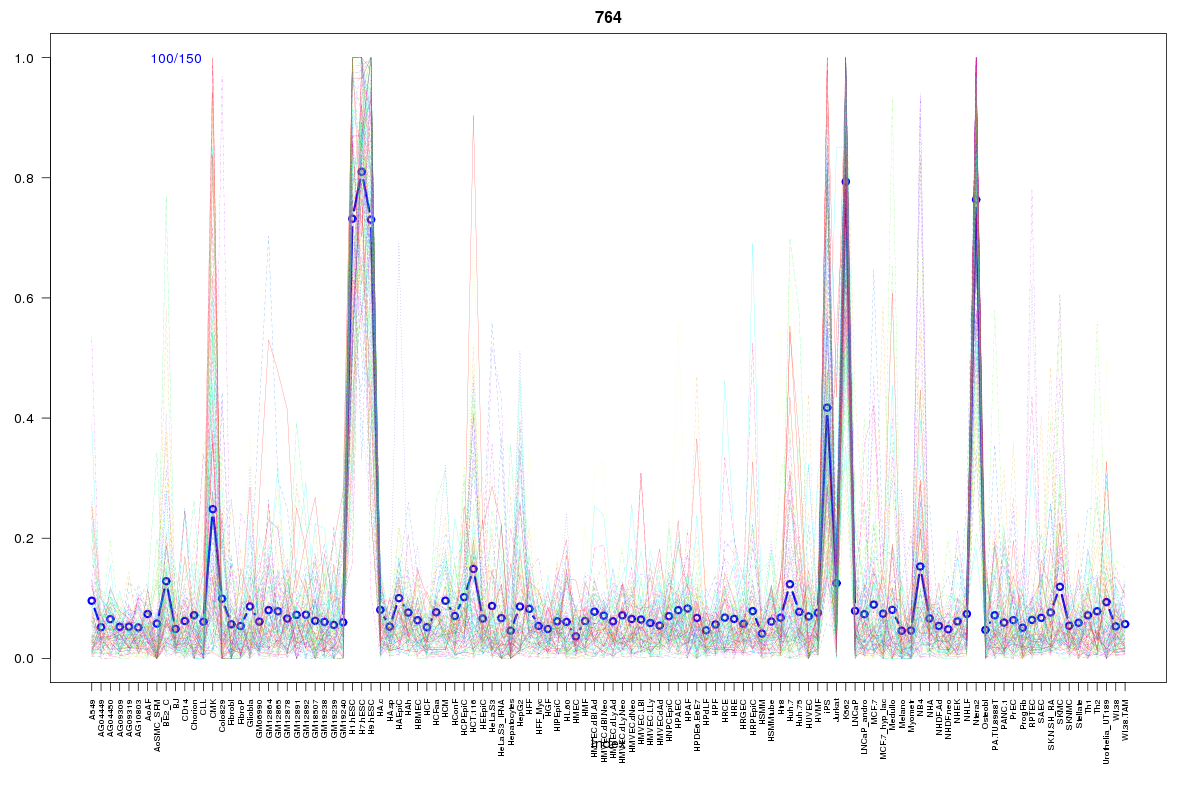
Cluster Hypersensitivity Profile

Genomic Location Trend
These plots show the distribution of the DHS sites surrounding the Transcript Start Site of the nearest gene.
Stats
Number of sites: 150Promoter: 4%
CpG-Island: 1%
Conserved: 28%
Enriched Motifs & Matches
Match Detail: [Jaspar]
|
| ||
|---|---|---|
| Sites: 34/100 | e-val: 0.00000000042 | ||
| Factor | e-val(match) | DB |
| SP1 | 1.1102e-16 | JASPAR |
| Pax4 | 0.0000060058 | JASPAR |
| Klf4 | 0.00015426 | JASPAR |
| MZF1_1-4 | 0.00020318 | JASPAR |
| PPARG::RXRA | 0.0014458 | JASPAR |
BED file downloads
Top 10 Example Regions
| Location | Gene Link | Dist. |
|---|---|---|
| chrX: 113281640-113281790 | U3 | 59.59 |
| chrX: 113281640-113281790 | RNU1-57P | 59.59 |
| chrX: 113281640-113281790 | RN7SL93P | 59.59 |
| chr10: 30842120-30842270 | HNRNPA1P32 | 60 |
| chr8: 142361920-142362070 | CTD-3064M3.4 | 62.53 |
| chr7: 29833260-29833410 | WIPF3 | 67.89 |
| chr2: 47561600-47561750 | MSH2 | 74.5 |
| chr2: 47561600-47561750 | EPCAM | 74.5 |
| chrX: 2807840-2807990 | GYG2 | 75.84 |
| chr11: 47965580-47965730 | NUP160 | 79.39 |