SOM cluster: 779
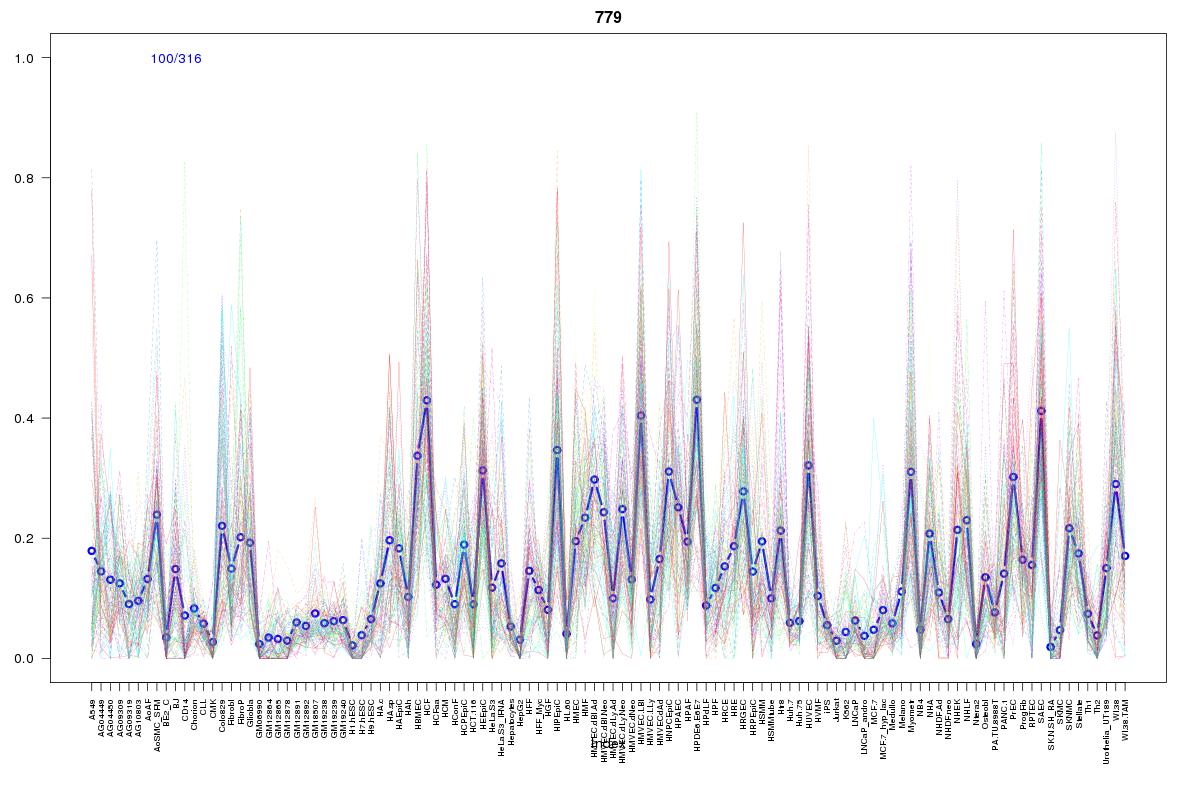
Cluster Hypersensitivity Profile

Genomic Location Trend
These plots show the distribution of the DHS sites surrounding the Transcript Start Site of the nearest gene.
Stats
Number of sites: 316Promoter: 2%
CpG-Island: 0%
Conserved: 23%
Enriched Motifs & Matches
Match Detail: [Jaspar]
|
| ||
|---|---|---|
| Sites: 49/100 | e-val: 1.1e-24 | ||
| Factor | e-val(match) | DB |
| AP1 | 0.0000000035896 | JASPAR |
| NFE2L2 | 0.0000012867 | JASPAR |
| PBX1 | 0.001831 | JASPAR |
| NFE2L1::MafG | 0.013673 | JASPAR |
| Pax6 | 0.01567 | JASPAR |
BED file downloads
Top 10 Example Regions
| Location | Gene Link | Dist. |
|---|---|---|
| chr3: 170158240-170158390 | SKIL | 41.39 |
| chr7: 16169540-16169690 | RPL36AP29 | 41.57 |
| chr7: 16169540-16169690 | ISPD-AS1 | 41.57 |
| chr1: 66954940-66955090 | SGIP1 | 44.47 |
| chr7: 42229240-42229390 | GLI3 | 45.3 |
| chr3: 111655940-111656090 | PHLDB2 | 68.07 |
| chr1: 172936380-172936530 | RP3-471M13.2 | 71.72 |
| chr3: 98704380-98704530 | DCBLD2 | 72.03 |
| chr7: 65518620-65518770 | RP5-1132H15.1 | 72.15 |
| chr9: 116920120-116920270 | COL27A1 | 73.52 |